
Disclaimer: The opinions expressed by our writers are their own and do not represent the views of U.Today. The financial and market information provided on U.Today is intended for informational purposes only. U.Today is not liable for any financial losses incurred while trading cryptocurrencies. Conduct your own research by contacting financial experts before making any investment decisions. We believe that all content is accurate as of the date of publication, but certain offers mentioned may no longer be available.
According to the Brave New Coin liquidity index for Bitcoin, we may see the approach of BTC to the fundamental support level of the 200-week moving average, which had previously acted as the foundation of a trend reversal.
BraveNewCoin liquidity Index
The index developed by BNC is a tool for tracking the market price of Bitcoin, at which liquidity could enter or exit a Bitcoin position. Simply put, BNC offers the "real" price of Bitcoin by using the liquidity data. The index is widely used by crypto traders and investors for settlement and spot pricing. According to the page on the official BNC website, the index calculates data every 30 seconds.
But at the same time, there is not much of a difference in using BLX or the regular Bitcoin spot price chart in order to see the movements we have mentioned above. By using a logarithmic scale, we could see two Bitcoin "double bottom" patterns since 2015.
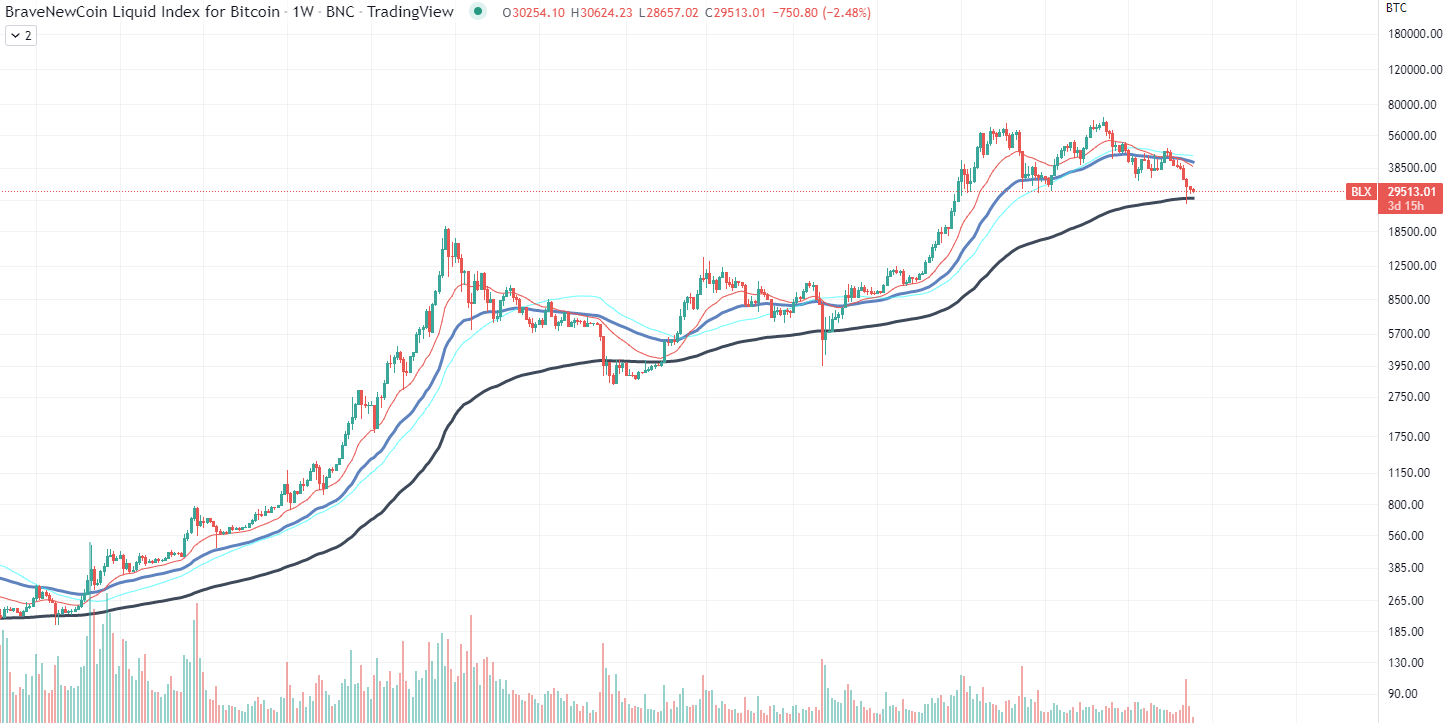
As for now, Bitcoin is on its way to form the first part of the formation by reaching the 200-week moving average, which has been used by the first cryptocurrency as a foundation for a reversal since 2013.

Bitcoin already tested the support back at the beginning of May and successfully bounced off it and returned above the $30,000 price threshold. The presence of such a strong support line on the chart explains Bitcoin's price action in the last 16 days.
BTC's volatility has dropped to an extreme low after May 12 following the massive 25% correction, which happened in a matter of four days.
 Dan Burgin
 U.Today Editorial Team