Disclaimer: The opinions expressed by our writers are their own and do not represent the views of U.Today. The financial and market information provided on U.Today is intended for informational purposes only. U.Today is not liable for any financial losses incurred while trading cryptocurrencies. Conduct your own research by contacting financial experts before making any investment decisions. We believe that all content is accurate as of the date of publication, but certain offers mentioned may no longer be available.
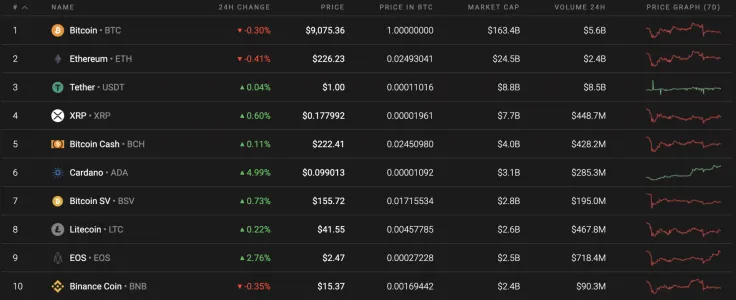
Nothing crucial has changed within the cryptocurrency market since yesterday. Bitcoin (BTC) remains in relatively the same position, while altcoins are moving upwards. However, the rise does not apply to all of them. This mostly applies to Ethereum (ETH), which has lost 0.40% since yesterday.
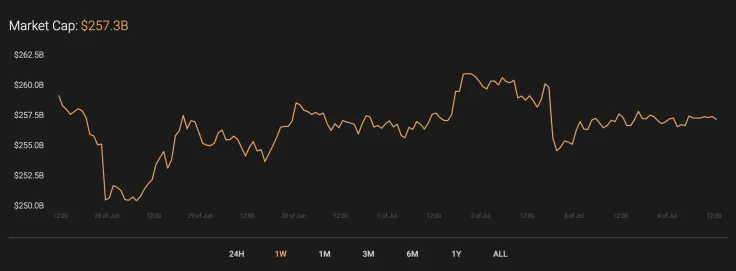
While the majority of coins continue trading sideways, the overall market capitalization has decreased by about $2B over the 24 hours. The current index sits at $257.3B.
Below is the relevant data for Bitcoin (BTC) and how it's looking today:
-
Name: Bitcoin
Advertisement -
Ticker: BTC
-
Market Cap: $166,948,147,028
-
Price: $9,062.06
Advertisement -
Volume (24H): $12,960,718,101
-
Change (24H): -0.09%
BTC/USD: Can Bulls Withstand Bears' Pressure and Keep Bitcoin Above $9,000?
The start of weekend continues with Bitcoin's sideways trend. Over the last 24 hours, the price change has gone down -0.3%, while the price dropped -1.17% from the previous week.
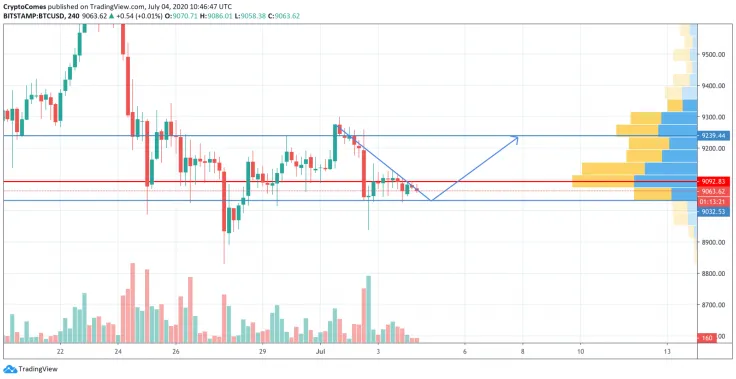
Looking at the hourly chart, Bitcoin (BTC) has been trading in the $9,100-$9,150 range. However, the bears are considered to have gained more strength than bulls as the coin is inching closer to the $9,000 mark. From another perspective, a continuing decline is unlikely to occur as the trading volume is already at its minimum levels. In this particular case, one might expect a bounce from $9,000, followed by a continued rise to the $9,250 mark.
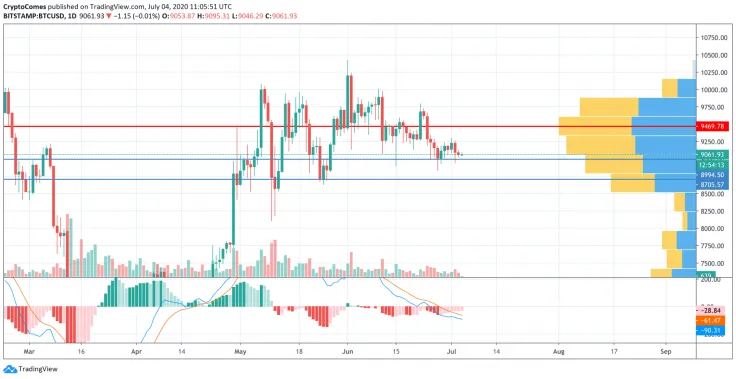
Looking at the daily time frame, the situation looks similar as sellers are approaching the $8,500 - the breaking point for the ongoing growth. The Moving Average Convergence/Divergence (MACD) is already located in the red, which confirms the bearish sentiments. To sum it, there is a high probability of a $8,700 retest if the bulls cannot maintain the $9,000 mark.
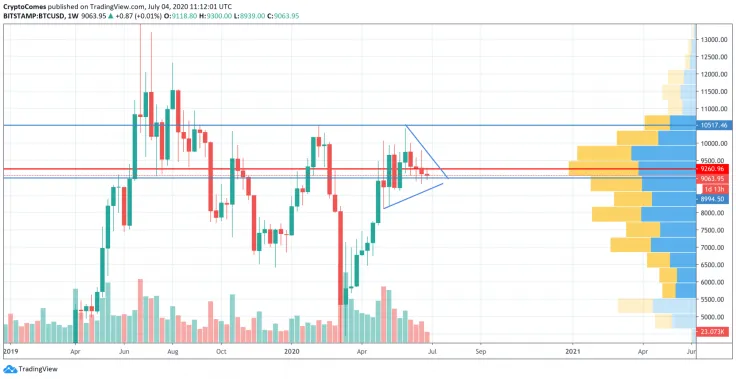
According to the weekly chart, Bitcoin (BTC) is about to finish up in a wedge pattern formation. It is the figure of the continuing trend, which means that the price of the leading crypto is likely to go up. If that scenario comes true, then the closest resistance level is $10,500 which the bulls may attain by the end of summer.
At press time, Bitcoin was trading at $9,072.
 Caroline Amosun
 Tomiwabold Olajide
 Dan Burgin
 Gamza Khanzadaev
 Arman Shirinyan