Disclaimer: The opinions expressed by our writers are their own and do not represent the views of U.Today. The financial and market information provided on U.Today is intended for informational purposes only. U.Today is not liable for any financial losses incurred while trading cryptocurrencies. Conduct your own research by contacting financial experts before making any investment decisions. We believe that all content is accurate as of the date of publication, but certain offers mentioned may no longer be available.
After a slight decrease over the weekend, the market has recovered its position and come back into the bullish zone. The rise is not significant, however, almost all of the top 10 coins are in the green zone.
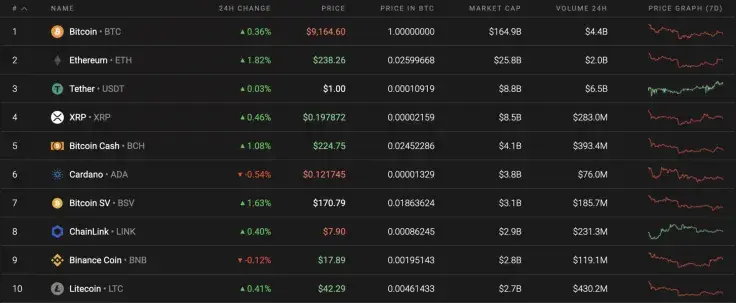
As altcoins are more volatile than Bitcoin (BTC), the market share of the leading crypto has declined and now makes up 61.1%.
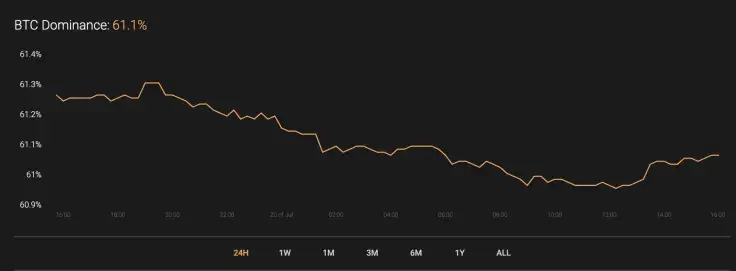
This is the relevant data for Bitcoin (BTC) and how it is looking today:
-
Name: Bitcoin
Advertisement -
Ticker: BTC
-
Market Cap: $168,687,852,084
-
Price: $9,149.10
Advertisement -
Volume (24h): $13,449,392,890
-
Change (24h): 0.38%
The data is current at press time.
BTC/USD: Can the resistance at $9,400 be reached soon?
Bitcoin (BTC) keeps trading in the range between $9,100 and $9,200 for quite a while. Over the past week, the price change has constituted -1.33%.
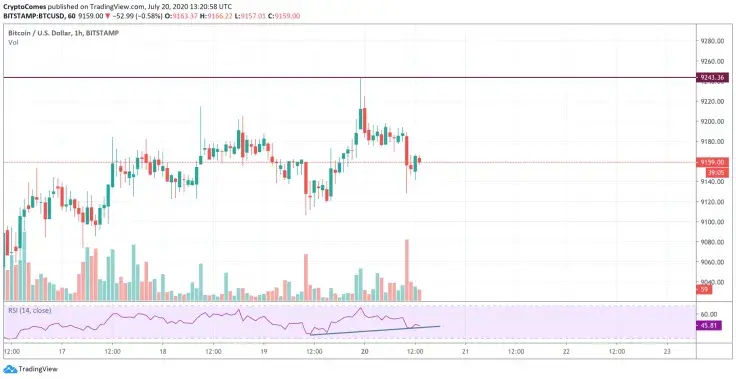
On the hourly chart, Bitcoin (BTC) has touched resistance at $9,250, followed by a fast decline. However, the main crypto is unlikely to group below $9,000 from current levels as the bears' pressure is coming to an end based on the trading volume decline.
Moreover, the bullish divergence on the RSI indicator confirms a possible bounce off. In this case, one may expect another growth wave to $9,250. If bulls can fix above it, the rise is about to continue.
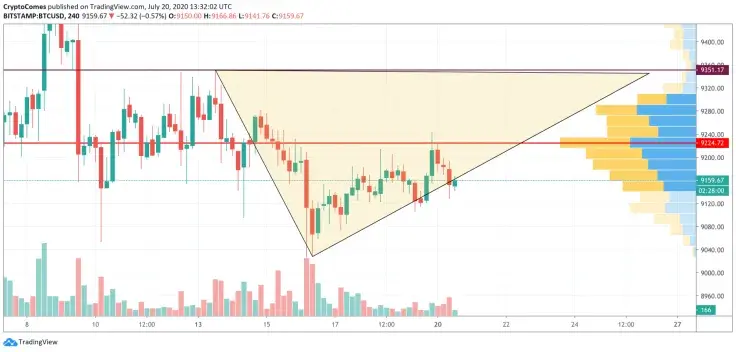
On the 4H chart, the growth scenario is also relevant within the formation of the triangle pattern. Further, there is a high level of liquidity above $9,200, which means that a rise is more likely than a drop. If Bitcoin (BTC) keeps rising higher, the vital resistance at which buyers may encounter problems is the $9,350 mark—the far retest of July 13.
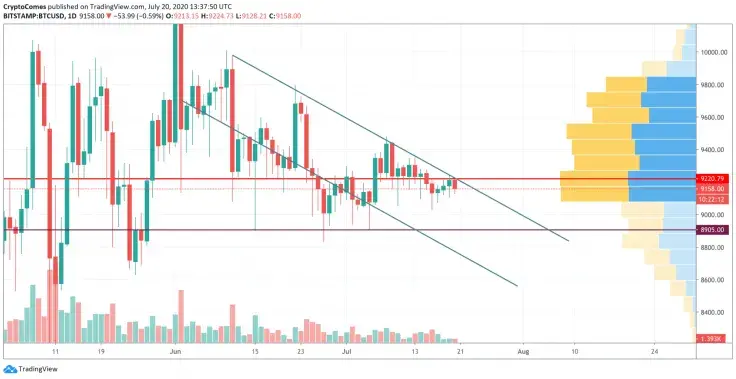
On the daily time frame, the situation is reversed. Trading is taking place within the descending channel, and a possible rise to $10,000 might occur if Bitcoin (BTC) retests the $8,900 mark. This may happen by the end of July; however, if bears push it below $8,500, the growth scenario will be canceled out.
Bitcoin is trading at $9,159 at press time.

 Gamza Khanzadaev
 Yuri Molchan
 Arman Shirinyan
 Alex Dovbnya