Disclaimer: The opinions expressed by our writers are their own and do not represent the views of U.Today. The financial and market information provided on U.Today is intended for informational purposes only. U.Today is not liable for any financial losses incurred while trading cryptocurrencies. Conduct your own research by contacting financial experts before making any investment decisions. We believe that all content is accurate as of the date of publication, but certain offers mentioned may no longer be available.
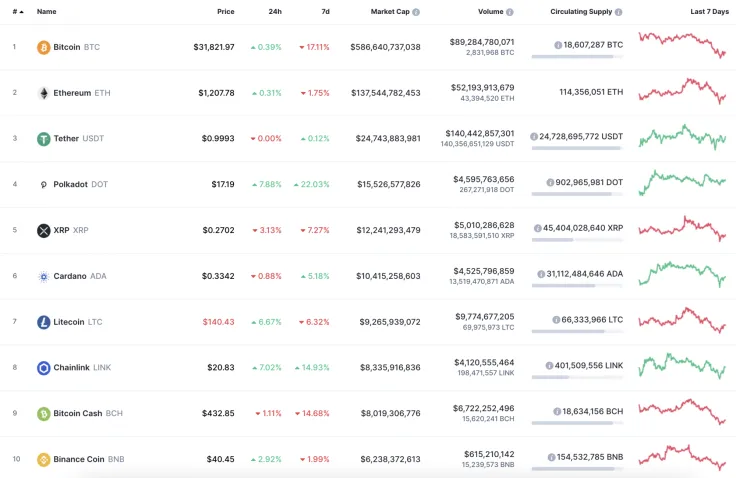
The cryptocurrency market has slightly recovered after yesterday's drop, however, not all coins are in the green zone. XRP is the main loser, falling by 3%.
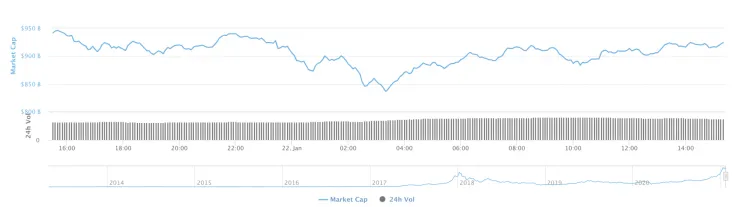
The total market capitalization has been affected by the drop and its index has dropped by around $20 billion.
The relevant data for Bitcoin today:
-
Name: Bitcoin
Advertisement -
Ticker: BTC
-
Market Cap: $596,604,774,871
-
Price: $32,245.59
Advertisement -
Volume (24h): $89,237,999,865
-
Change (24h): 1.32%
The data is relevant at press time.
BTC/USD: Is yesterday's drop the last one before $50,000?
Yesterday morning, the Bitcoin (BTC) price rolled back to the support at $34,000, but this level could not stop the onslaught of bears. In the afternoon, the pair were already testing the support at $32,600.
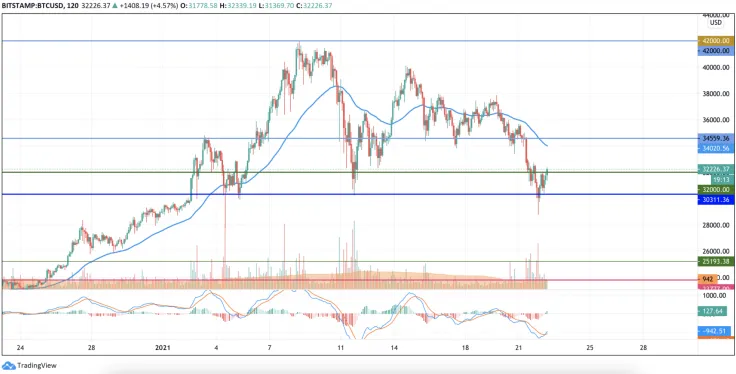
In the afternoon, sellers broke below $32,000, and tonight a strong bearish momentum pierced the psychological level of $30,00, setting a local low around $29,760.
This morning the pair has recovered above the psychological level of $30,000, and if buyers can gain a foothold above this level, consolidation is possible in a sideways range with resistance at $32,600. However, if sales volumes continue to grow, then the pullback will reach the level of $28,000.
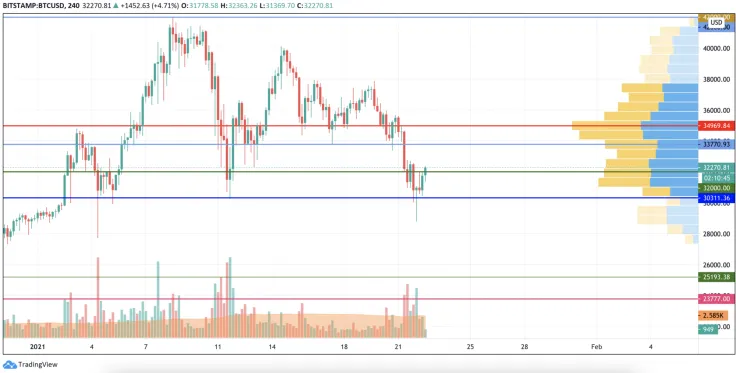
On the 4H chart, Bitcoin (BTC) is likely to restest the local resistance at $33,770 as part of a correction move. Thus, there is a high concentration of liquidity there.
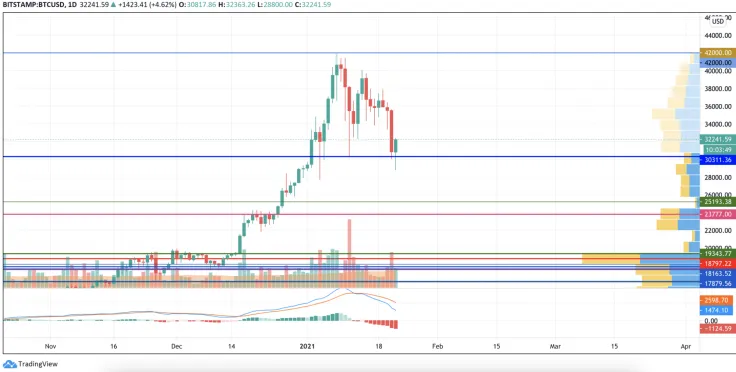
On the daily time frame, a further decline is still possible as the area where most of the volume is focused ($23,000-$26,000) has not been tested yet. Moreover, the lines of the MACD indicator are in the red zone, which confirms the local bearish trend.
Bitcoin is trading at $32,395 at press time.
 Dan Burgin
 U.Today Editorial Team