Disclaimer: The opinions expressed by our writers are their own and do not represent the views of U.Today. The financial and market information provided on U.Today is intended for informational purposes only. U.Today is not liable for any financial losses incurred while trading cryptocurrencies. Conduct your own research by contacting financial experts before making any investment decisions. We believe that all content is accurate as of the date of publication, but certain offers mentioned may no longer be available.
The weekend started in neutral mode for the cryptocurrency market. However, some of the top 10 coins are in the green. Ethereum (ETH) and EOS have risen 0.83% and 0.32% respectively.
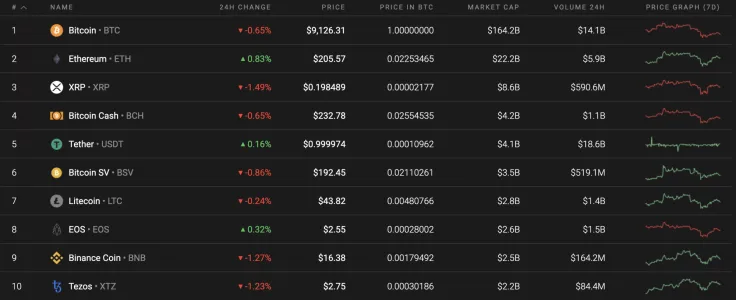
At the same time, the total market capitalization has gone down a few points as the current index sits at $247.2 billion.
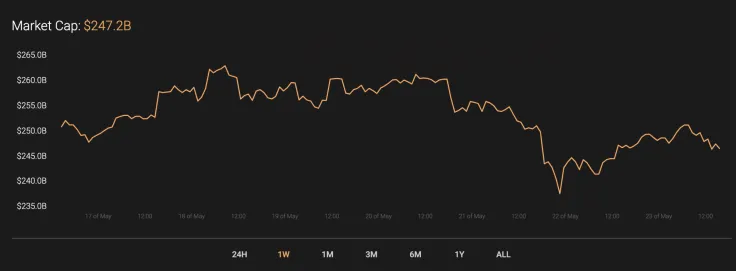
Below is the relevant data for Bitcoin (BTC) and how it is looking today:
-
Name: Bitcoin
Advertisement -
Ticker: BTC
-
Market Cap: $167,807,556,504
-
Price: $9,128.00
Advertisement -
Volume (24H): $28,564,887,375
-
Change (24H): -0.46%
BTC/USD: Has the Correction Started or is it on Pause Before Running to $10,000?
Yesterday, trading volumes were below average and were fairly calm. There was no pressure from the bears. Buyers were able to gain a foothold above $9,000 and continued their recovery to a two-hour EMA55 in small volumes.
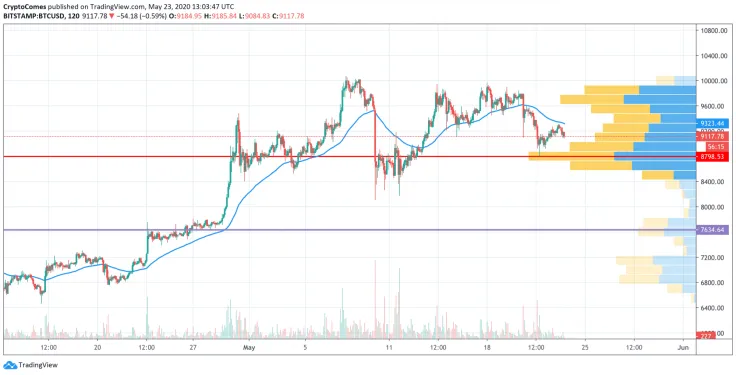
If the pair overcomes the moving average today, then the price of Bitcoin (BTC) will test the resistance at $9,440. To gain a foothold above this resistance, buyers should increase their volumes.
In case growth is not supported by the volumes, then BTC will not be able to overcome this resistance level and the pair will return below the Percentage-of-Completion (POC) line ($8,858) by the end of the week.
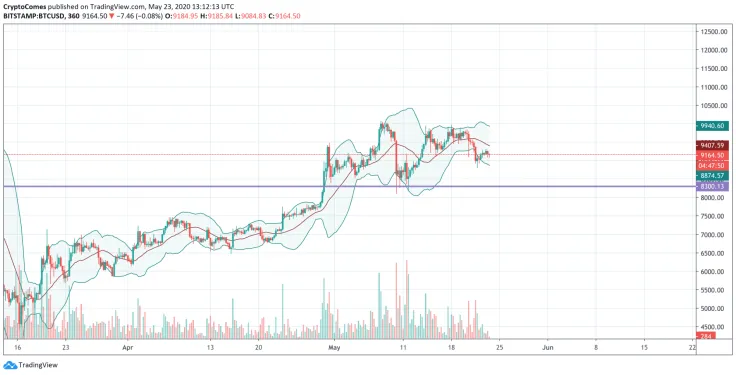
Looking at the 6H chart, almost nothing indicates continued growth. Most of trading volume was around the local peak at $10,000, which was followed by the ongoing decline. In addition, the Bollinger Bands lines are moving down, confirming our bearish sentiments. If Bitcoin (BTC) fails to fix above $9,000, then it might drop to $8,300 next week.
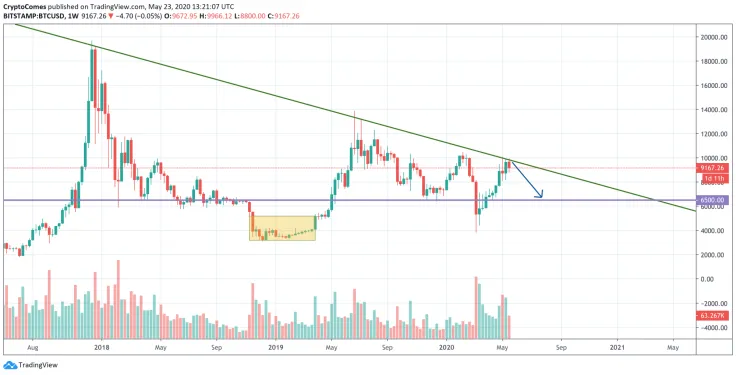
Looking at the weekly time frame, one can see that the accumulation period is yet to start as it did at the beginning of 2019. The current situation might be considered a bounce back and not the start of a long-term bullish trend. What is more, Bitcoin (BTC) could not break the descending channel that was formed when it reached $20,000 in December 2017. In short, the local bottom has not been formed and one may expect a more profound decline. In this particular case, the first level is at $6,500.
At press time, Bitcoin was trading at $9,146.

 Arman Shirinyan
 Alex Dovbnya
 Denys Serhiichuk