
Disclaimer: The opinions expressed by our writers are their own and do not represent the views of U.Today. The financial and market information provided on U.Today is intended for informational purposes only. U.Today is not liable for any financial losses incurred while trading cryptocurrencies. Conduct your own research by contacting financial experts before making any investment decisions. We believe that all content is accurate as of the date of publication, but certain offers mentioned may no longer be available.
The Solana/Ethereum price chart provides an intriguing vantage point for investors looking beyond the usual USD pairing. It is important to delve into the SOL/ETH chart to unearth local resistance and support levels and to understand the implications of Solana's performance against Ethereum, its main competitor.
The SOL/ETH chart, often overshadowed by its USD version, is a benchmark for internetwork competition and capital flows between two major ecosystems. Analyzing Solana's value in terms of Ethereum allows investors to track the relative investment appeal and technological momentum of each blockchain.
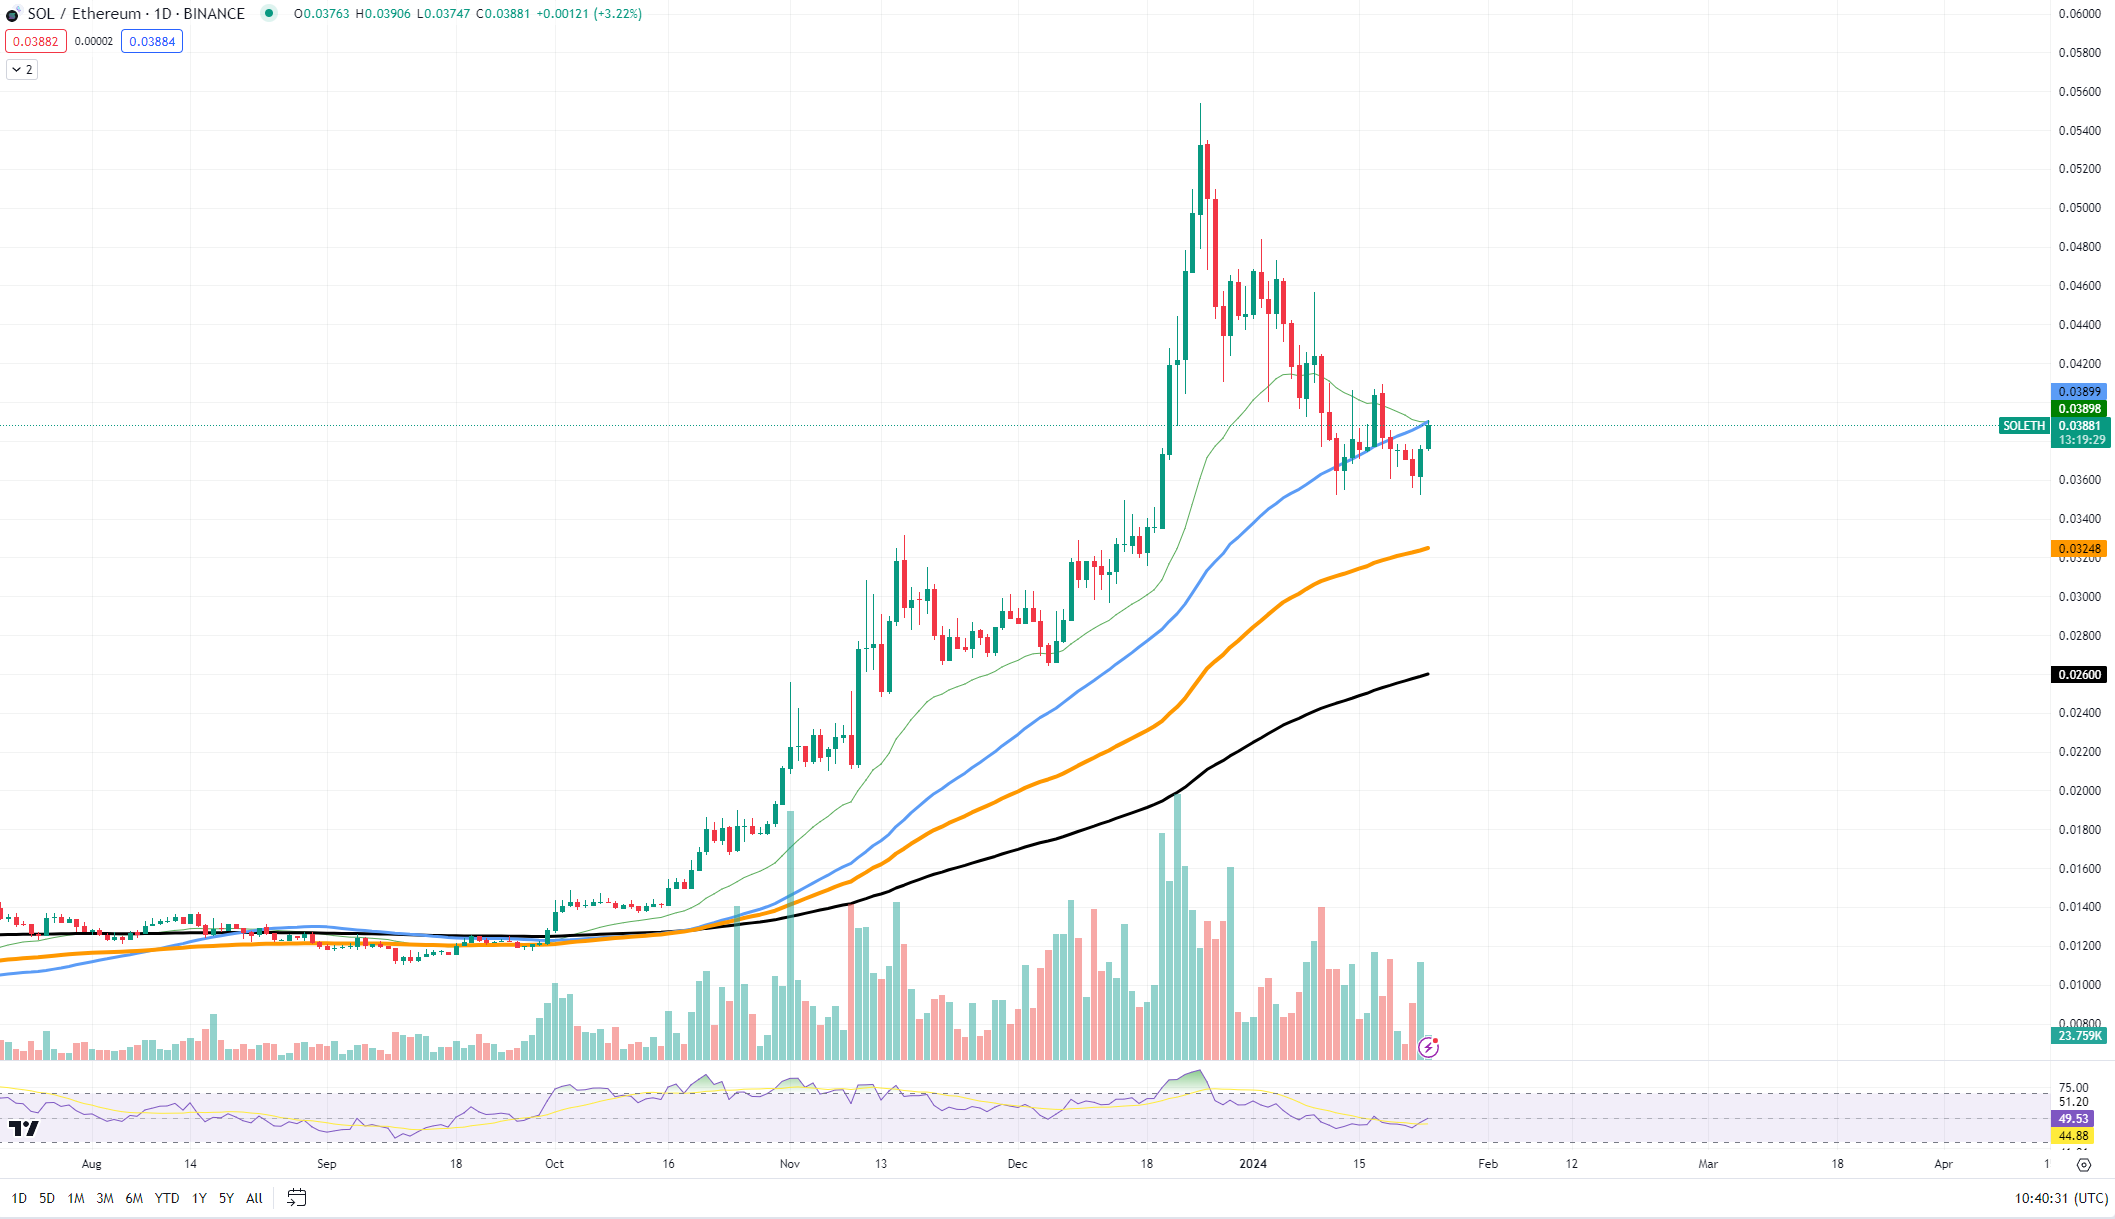
Currently, Solana shows signs of potential breakout against Ethereum, which could signal a forthcoming surge in the meme coin market, DeFi activities and other Solana-centric applications. A rise in SOL against ETH implies growing investor confidence in Solana's infrastructure, possibly anticipating market-related events or new developments.
Conversely, a drop in Solana's value against Ethereum can be seen as a bullish case for ETH, suggesting that funds are moving in favor of the more established network. Such trends are vital for investors seeking to gauge the recovery and growth trajectory of these platforms.
Turning to the SOL/USDT chart, we identify specific price levels that mark support and resistance. Support levels represent price points where a downtrend pauses due to a concentration of demand, while resistance levels indicate where an uptrend may halt due to selling pressure.
At the time of writing, Solana has shown resilience at a support level around $88.65, suggesting a strong buyer presence at this valuation. On the upside, resistance looms near the $92.31 mark, where sellers have historically stepped in.