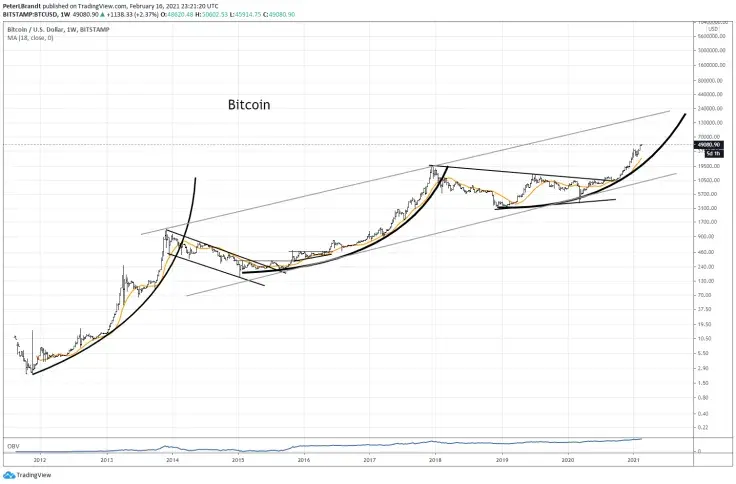
Veteran trader Peter Brandt has noted that Bitcoin is in the middle of yet another parabolic advance in a recent tweet.
As displayed on his chart, it started in late 2018 when the largest cryptocurrency was bottoming at roughly $3,100. Bitcoin is up 1,331 percent since that level.

Brandt—who has amassed almost 45 years of trading experience—says that seeing three parabolic advances on a logarithmic chart in the span of ten years is truly “historic.”
The danger of parabolic moves
Speaking in purely mathematical terms, parabolic advances are characterized by the increasing angle of ascent. Such formations are highly sought-after among traders due to immense returns.
With that being said, Brandt also cautioned against jumping on the train when a parabolic advance already becomes obvious in his January tweet:
Once a parabolic advance is obvious, it is way to late to be a buyer. The train has left the station. If you do not already own a market by the time I point out a parabolic trend, then don't buy based on my chart.
Parabolic trends tend to be very perilous since it is incredibly difficult to time the top when buying frenzy kicks into high gear and numbers just keep going up. However, immense vertical moves cannot be sustained forever, which why they are usually followed by sharp trend reversals.
An 80 percent correction is likely
Back in January 2018, Brandt noticed that Bitcoin’s previous parabolic advance had been violated. It was followed by an 80 percent correction that the legendary chartist accurately predicted.
Now, Brandt expects that a similar drawdown could occur as soon as the ongoing parabolic move is over.
80% corrections are most common when parabolic advances are violated.
Bitcoin is trading at $49,563 after surpassing the $50,000 mark on all major exchanges on Feb. 16.

 Vladislav Sopov
 Dan Burgin