Disclaimer: The opinions expressed by our writers are their own and do not represent the views of U.Today. The financial and market information provided on U.Today is intended for informational purposes only. U.Today is not liable for any financial losses incurred while trading cryptocurrencies. Conduct your own research by contacting financial experts before making any investment decisions. We believe that all content is accurate as of the date of publication, but certain offers mentioned may no longer be available.
Just a few weeks ago, XRP registered a staggering 75% rally, a move that fueled a surge in trading activity and investor sentiment. As is usually the case with such sharp price movements, volatility was rampant, offering fertile ground for active traders.
However, following this massive surge, XRP's price dynamics took an unexpected turn. The cryptocurrency's volatility underwent a significant drop, a rare occurrence considering the usual high volatility that follows significant price movements. The market seemed to be in a state of flux as it tried to find a new equilibrium point after this price rally.
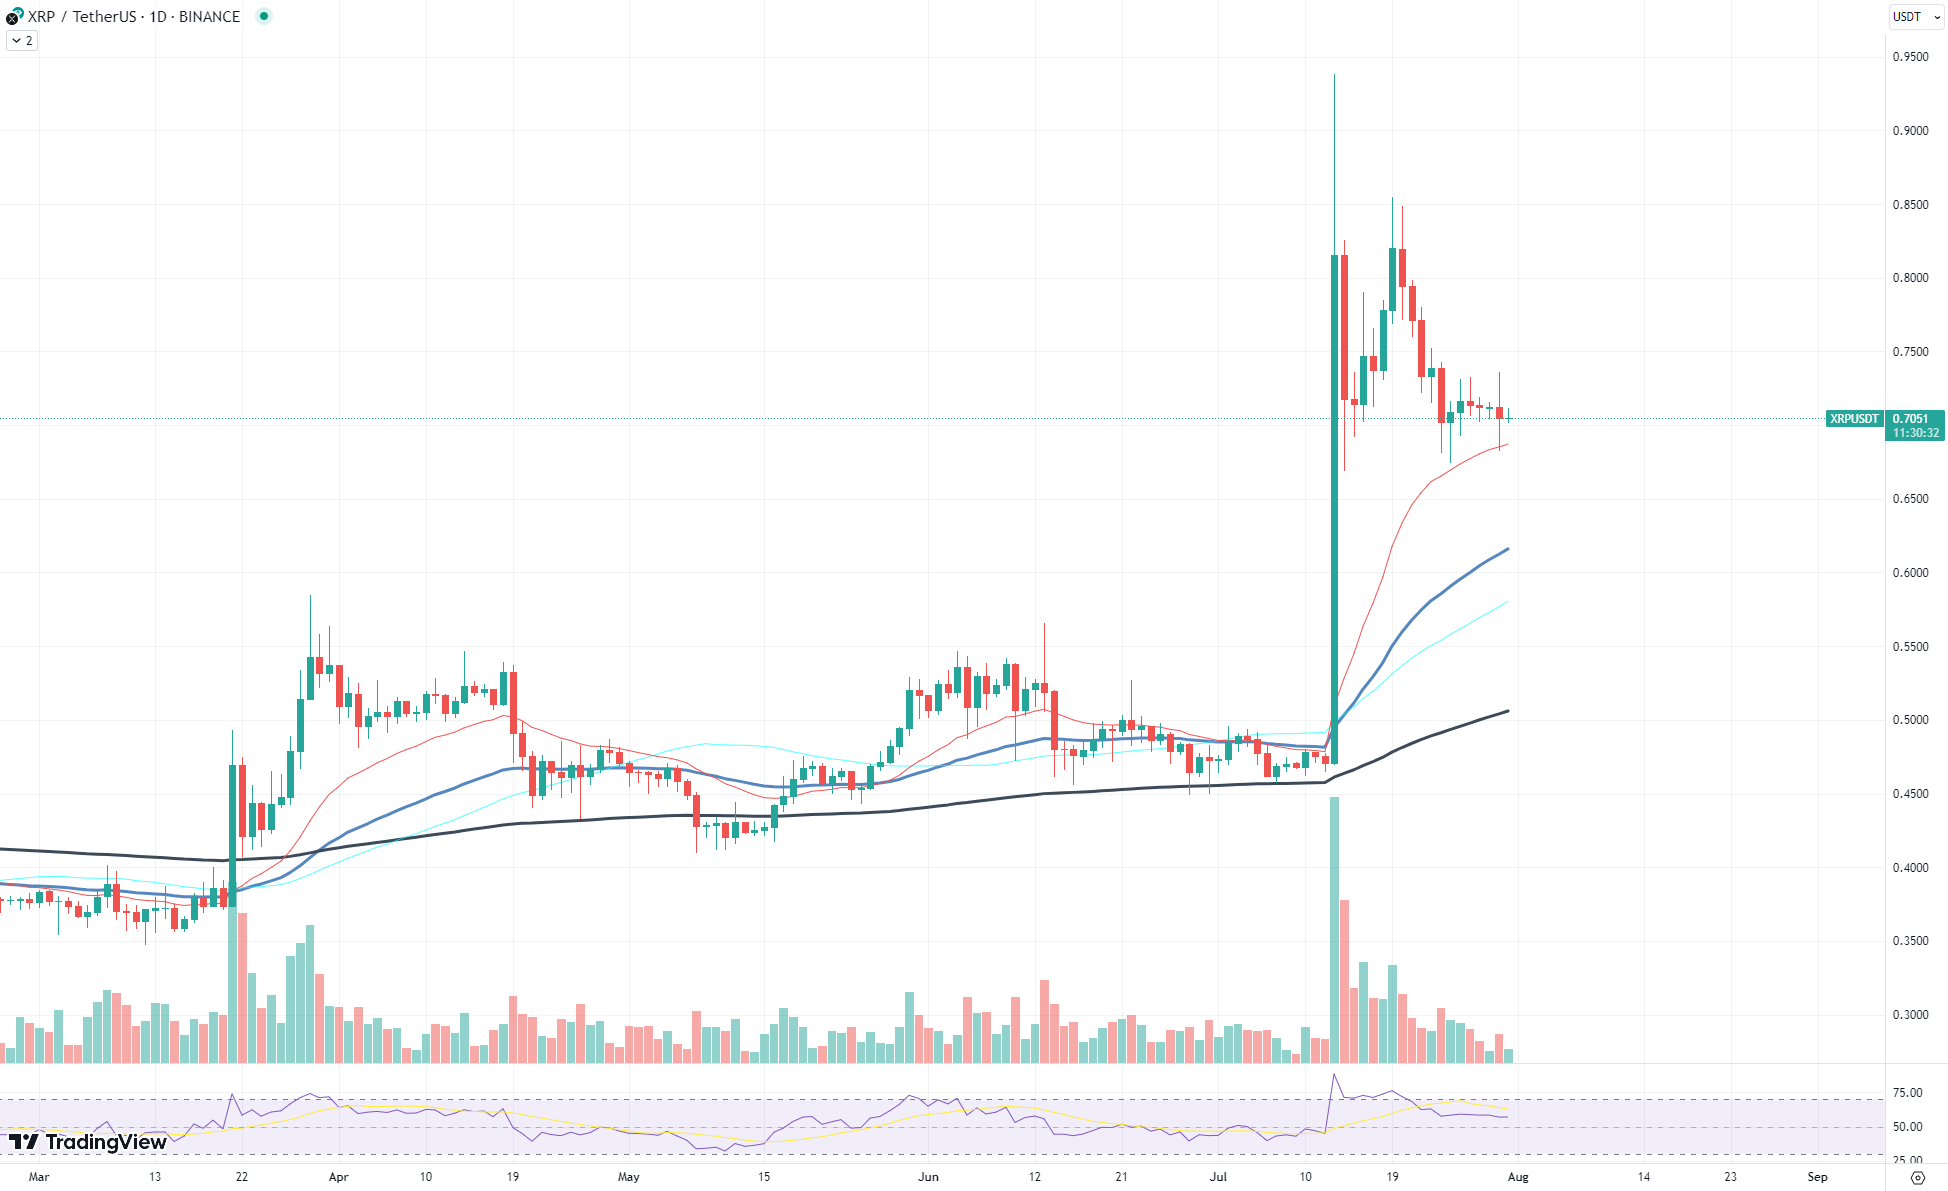
Adding more to this unusual phenomenon, XRP's moving averages (MAs) — a key tool in technical analysis — are showing signs of dispersion. This event, where the Exponential Moving Average (EMA), which emphasizes recent price changes, is drifting away from other MAs, is often interpreted as a sign of decreased volatility or price stabilization.
What is most interesting is that these moving averages are not converging, suggesting the possibility of a new norm of reduced volatility for XRP. Typically, the convergence of moving averages suggests the possible return of high volatility. Still, in this case, the lack of convergence indicates the likelihood of continued low volatility until further price stabilization.
So, what's next for XRP? While the current picture suggests a phase of price stabilization, market participants should keep an eye on this unexpected dynamic. The reduction in volatility, indicated by the dispersion of MAs, suggests that the digital asset may be entering a period of low volatility, which could potentially pave the way for steady growth.
Shiba Inu at key resistance level
Shiba Inu (SHIB), the meme-inspired cryptocurrency, has been a hot topic in the crypto market recently. It has now made significant strides, breaking a key resistance level, which validates the ascending triangle pattern we highlighted in a previous article. The cryptocurrency's success story demonstrates the effectiveness of technical analysis as a predictive tool in the volatile world of digital currencies.
For weeks, SHIB had been forming an ascending triangle, a bullish pattern that typically precedes a price breakout. Traders closely monitored the pattern, watching for any signs of an upward breakout. Their patience paid off. SHIB's price recently broke through the triangle's upper boundary, marking an important milestone in the coin's price history.

This breakout was accompanied by a surge in volatility, with the coin's price moving aggressively upward. Traders who had been banking on the ascending triangle's outcome would have been rewarded handsomely as SHIB rallied to higher price levels.
The first target following this breakout is the $0.0000089 level. This figure represents a significant psychological resistance point, which traders often closely watch. Moreover, it is also the level of a previous breakdown, further amplifying its significance. A successful break above this resistance level would further cement the coin's current bullish trajectory.
Looking further ahead, the next important target for SHIB is the 200 EMA (Exponential Moving Average) line, currently located around $0.00000920. Although this line could shift a little lower before the price reaches it, a successful break above would signal a trend change for SHIB.
Cardano already aims upward
Cardano (ADA) appears to be bucking the trend, showing a promising growth trajectory and successfully surging beyond the 50-day Exponential Moving Average (EMA).
Cardano, the fifth largest cryptocurrency by market cap, has recently been demonstrating admirable resilience amid turbulent market conditions. The digital asset, known for its smart contract platform, has been registering a steady uptrend while most cryptocurrencies are struggling with market corrections. In a significant development, Cardano's price has managed to surpass the 50-day EMA, which is often considered a key indicator of a short-term market trend.
This recent rally of Cardano has stirred up a wave of optimism among its investors. The successful breach of the 50-day EMA is generally viewed as a bullish sign, indicating a potential shift from a bearish to a bullish market trend. As Cardano's price positions itself above this moving average, it may suggest that the recent positive price movement is not merely a flash in the pan but could be part of a larger uptrend.
However, it is crucial to observe the declining trade volumes accompanying this rally. Despite the optimistic price action, waning volumes hint at a lack of strong buying pressure on the market. Lower volumes during a rally could suggest that the momentum might not sustain in the long run, and the ongoing rally could be temporary.
 Dan Burgin
 U.Today Editorial Team