Disclaimer: The opinions expressed by our writers are their own and do not represent the views of U.Today. The financial and market information provided on U.Today is intended for informational purposes only. U.Today is not liable for any financial losses incurred while trading cryptocurrencies. Conduct your own research by contacting financial experts before making any investment decisions. We believe that all content is accurate as of the date of publication, but certain offers mentioned may no longer be available.
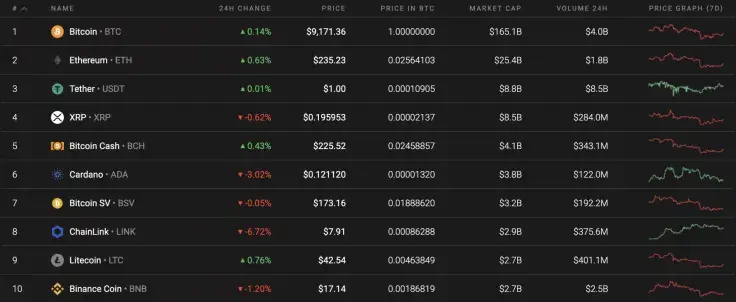
The weekend for the cryptocurrency market is neither bullish nor bearish. There is also a lack of dominance from buyers and sellers. Chainlink (LINK) is the biggest loser from the Top 10 coins as its rate has dropped by 6.72% since yesterday.
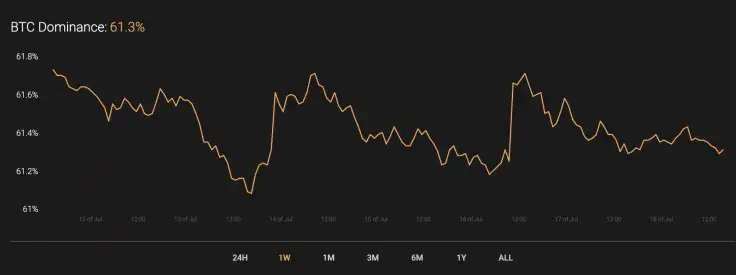
The dominance rate for Bitcoin (BTC) has declined over the course of the week as the leading cryptocurrency continues to trade sideways. The current market share of BTC stands at 61.3%.
Below is the relevant data for XRP and how it's looking today:
-
Name: XRP
Advertisement -
Ticker: XRP
-
Market Cap: $8 683 765 806
-
Price: $0,196209
Advertisement -
Volume (24H): $795,408,416
-
Change (24h): -0.49%
XRP/USD: How Much Time Do Buyers Need to Fix Above $0.20?
XRP is the only coin from the Top 3 that is located in the red. The altcoin has lost 0.62% since yesterday, and the decline over the course of the week has constituted a drop of 2.03%.
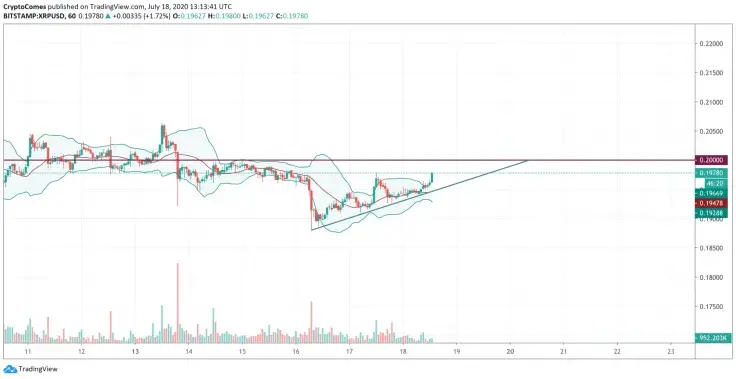
Looking at the hourly chart, XRP is about to retest the $0.20 resistance level. However, XRP's growth is unlikely to continue as the rise is not supported by the trading volume. Moreover, it continues to go down. In this particular case, there is a high probability of seeing a false breakout at the resistance level, followed by a continued drop in price.
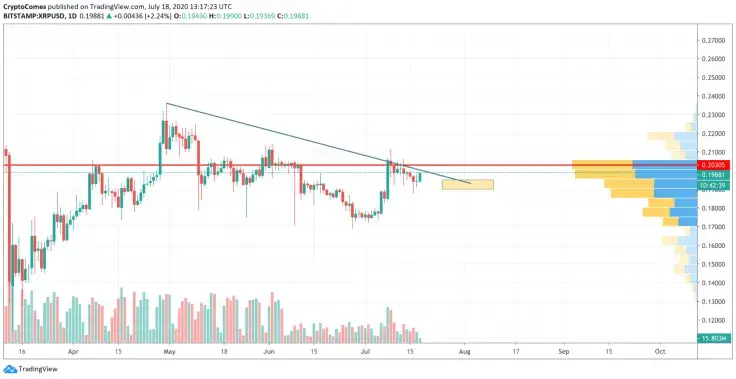
Looking at the daily chart, XRP is about to continue trading sideways through the end of July and the start of August 2020. The trading volume is not going down; however, it still does not have enough strength to grow.
Thus, the bulls could not manage to break from the falling channel, which was formed at the end of April 2020. Respectively, trading in the yellow between the $0.19 and $0.1950 range is the most likely option for XRP.
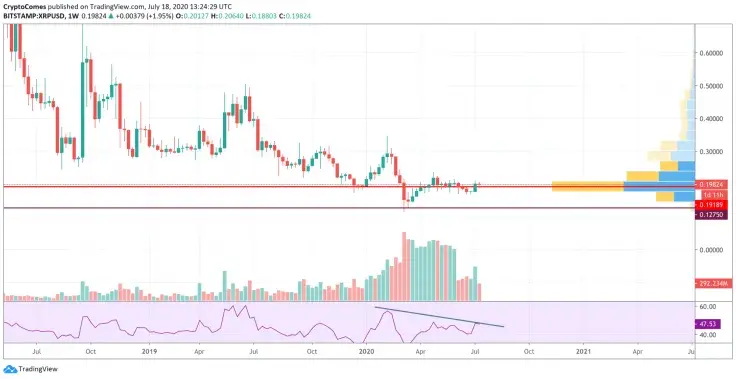
Looking at the weekly time frame, XRP is located in a sideways trend; however, the trading volume continues to decline. A bearish divergence has also been formed, which means that the coin might decline. The nearest support level is at $0.1275, which traders may attain by the end of Summer 2020 if they fail to fix above the $0.20 price shortly.
At press time, XRP was trading at $0.1987.
 U.Today Editorial Team
 Dan Burgin