Disclaimer: The opinions expressed by our writers are their own and do not represent the views of U.Today. The financial and market information provided on U.Today is intended for informational purposes only. U.Today is not liable for any financial losses incurred while trading cryptocurrencies. Conduct your own research by contacting financial experts before making any investment decisions. We believe that all content is accurate as of the date of publication, but certain offers mentioned may no longer be available.
The cryptocurrency market is slowly recovering after a drop over the weekend. At the moment, some of the top 10 coins are already located in the green zone.
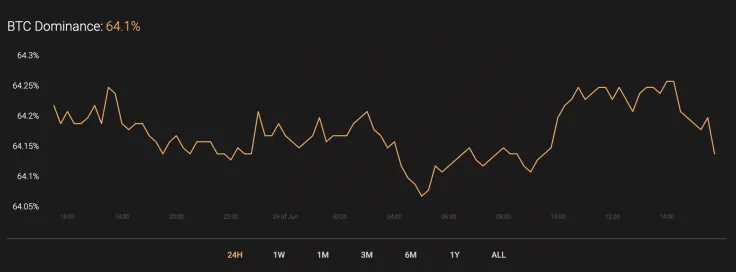
The dominance rate of Bitcoin (BTC) has remained almost unchanged over the past day, despite large fluctuations. The current index is 64.1%.
The relevant data for XRP is as follows.
-
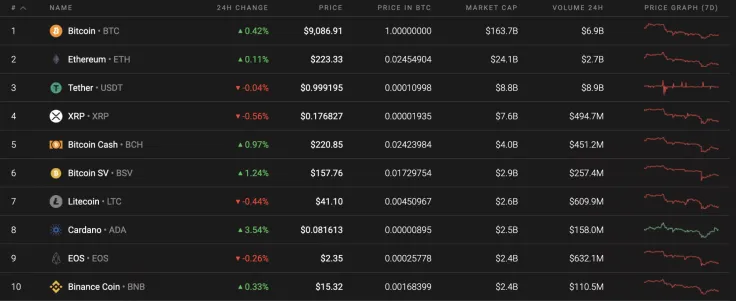
Name: XRP
Advertisement -
Ticker: XRP
-
Market Cap: $7,898,707,121
-
Price: $0.178470
Advertisement -
Volume (24h): $1,137,335,822
-
Change (24h): -0.28%
The data is relevant at press time.
XRP/USD: Bear pressure continues without significant bull resistance
On Saturday, under strong bearish pressure in the market, the XRP price tested support at $0.17 and set a monthly minimum at $0.169. On Sunday, buyers tried to restore the pair to the average price range, but the growth was not supported by a large volume and the price was not able to test the two-hour EMA55, which runs around $0.180.
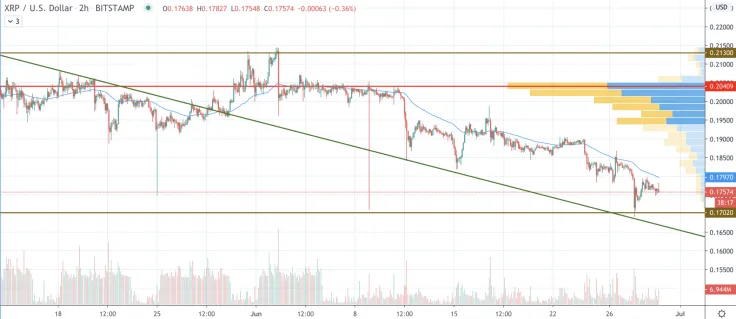
If buyers manage to increase volumes and continue to grow, then the pair might overcome the resistance of the moving average EMA55 and gain a foothold above the level of average prices. However, today the pair may return to the zone of the monthly minimum and soon roll back into the descending channel.
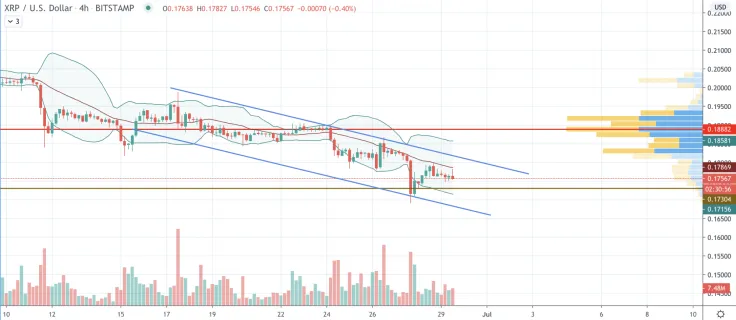
On the 4H chart, the decline of XRP continues against medium trading volume. However, there is no liquidity at current levels, which could help lead to further decline.
The lines of the Bollinger Bands indicator are also moving down, signaling ongoing bear pressure. All in all, there is a high probability of a retest of $0.1730 soon.
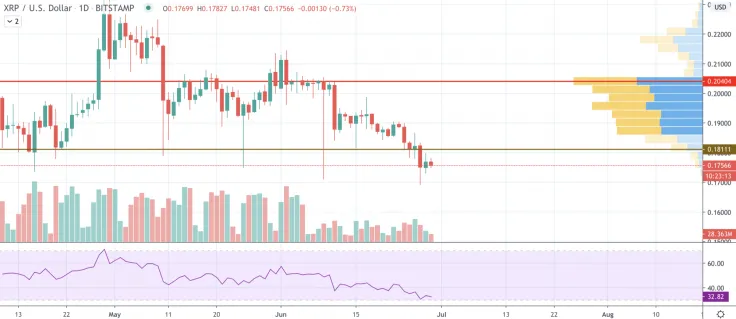
On the daily time frame, the situation might improve, to a certain extent. XRP has found the local bottom as the RSI indicator is located on the verge of the oversold area. Respectively, traders can expect a rollback to the closest retest zone at $0.1811 soon. The high liquidity level in this zone will serve as a magnet for XRP.
XRP is trading at $0.1756 at press time.
 Dan Burgin
 U.Today Editorial Team