Disclaimer: The opinions expressed by our writers are their own and do not represent the views of U.Today. The financial and market information provided on U.Today is intended for informational purposes only. U.Today is not liable for any financial losses incurred while trading cryptocurrencies. Conduct your own research by contacting financial experts before making any investment decisions. We believe that all content is accurate as of the date of publication, but certain offers mentioned may no longer be available.
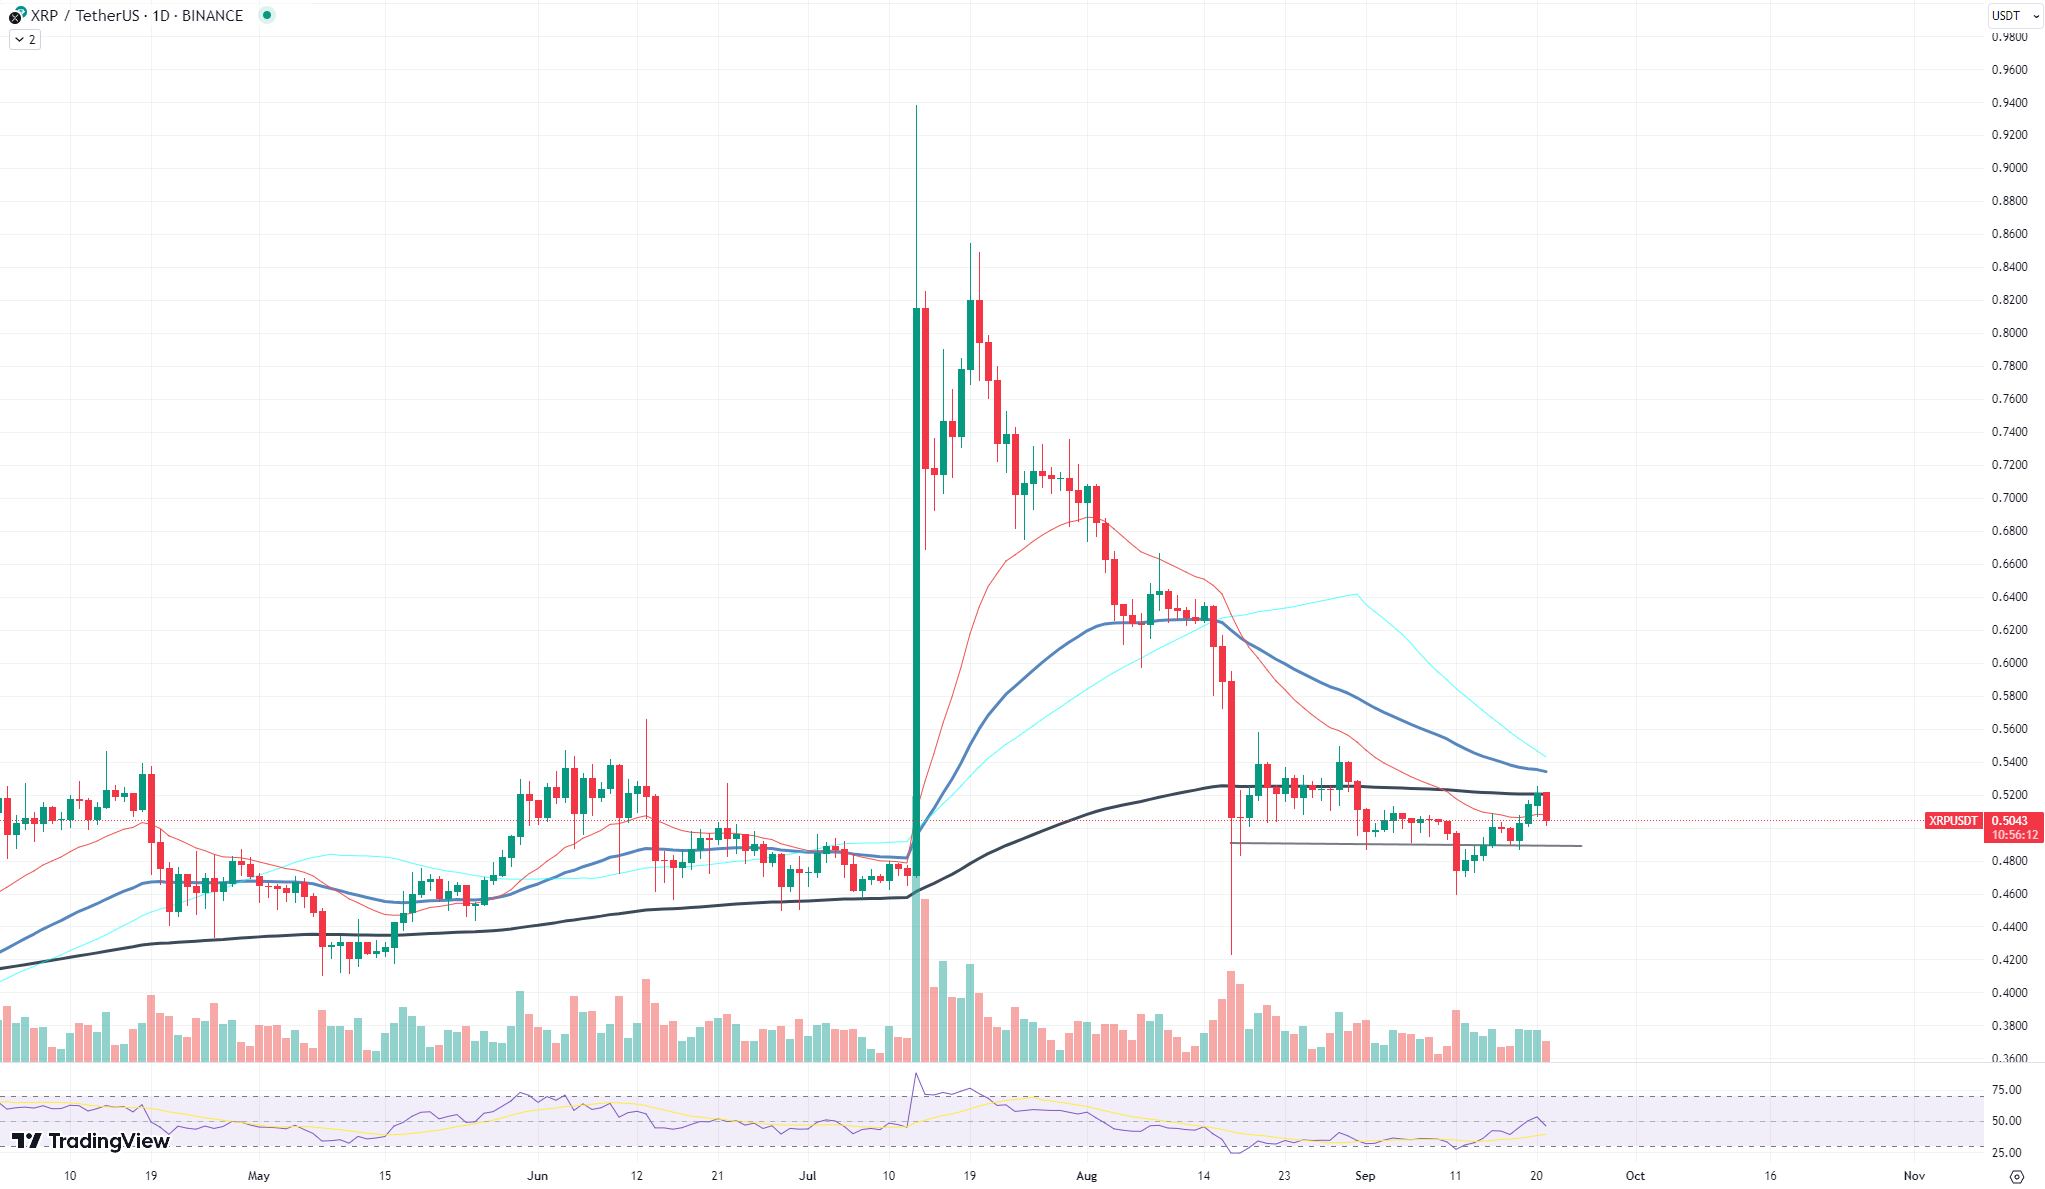
The cryptocurrency market is a dynamic space, and XRP's recent price trajectory is a testament to that. Over the past two weeks, XRP has experienced a significant downturn, with its price dropping from $0.6436 to a low of $0.4966. XRP's fall is not just a minor dip; it is a significant shift that has left a trail of puzzled investors and traders in its wake.
One of the most intriguing aspects of this decline is the sudden surge in both adjusted and real trading volume. Typically, a spike in trading volume can be an indicator of increased interest or activity around a particular asset. However, when this surge in volume is paired with a declining price, it often points to more bearish sentiment. In XRP's case, it seems that large whales might be offloading their holdings, especially at local resistance levels.

Speaking of resistance, the 200 EMA (Exponential Moving Average) daily line has been a significant barrier for XRP. For over a month, this line has acted as a ceiling, preventing the asset from breaking through and achieving higher price points. Every time XRP approached this line, it faced rejection, further solidifying the 200 EMA as a formidable resistance.
But why is the 200 EMA so crucial? In technical analysis, the 200 EMA is often viewed as a critical indicator of an asset's long-term trend. When prices are below this line, it is generally seen as a bearish sign, indicating that the asset is in a downtrend.
In the opposite way, when prices are above the 200 EMA, it is considered bullish. For XRP, being held down by this line for an extended period suggests that the market does not have enough bullish momentum to push the price upward.

 Yuri Molchan
 Godfrey Benjamin
 Gamza Khanzadaev
 Alex Dovbnya