Disclaimer: The opinions expressed by our writers are their own and do not represent the views of U.Today. The financial and market information provided on U.Today is intended for informational purposes only. U.Today is not liable for any financial losses incurred while trading cryptocurrencies. Conduct your own research by contacting financial experts before making any investment decisions. We believe that all content is accurate as of the date of publication, but certain offers mentioned may no longer be available.
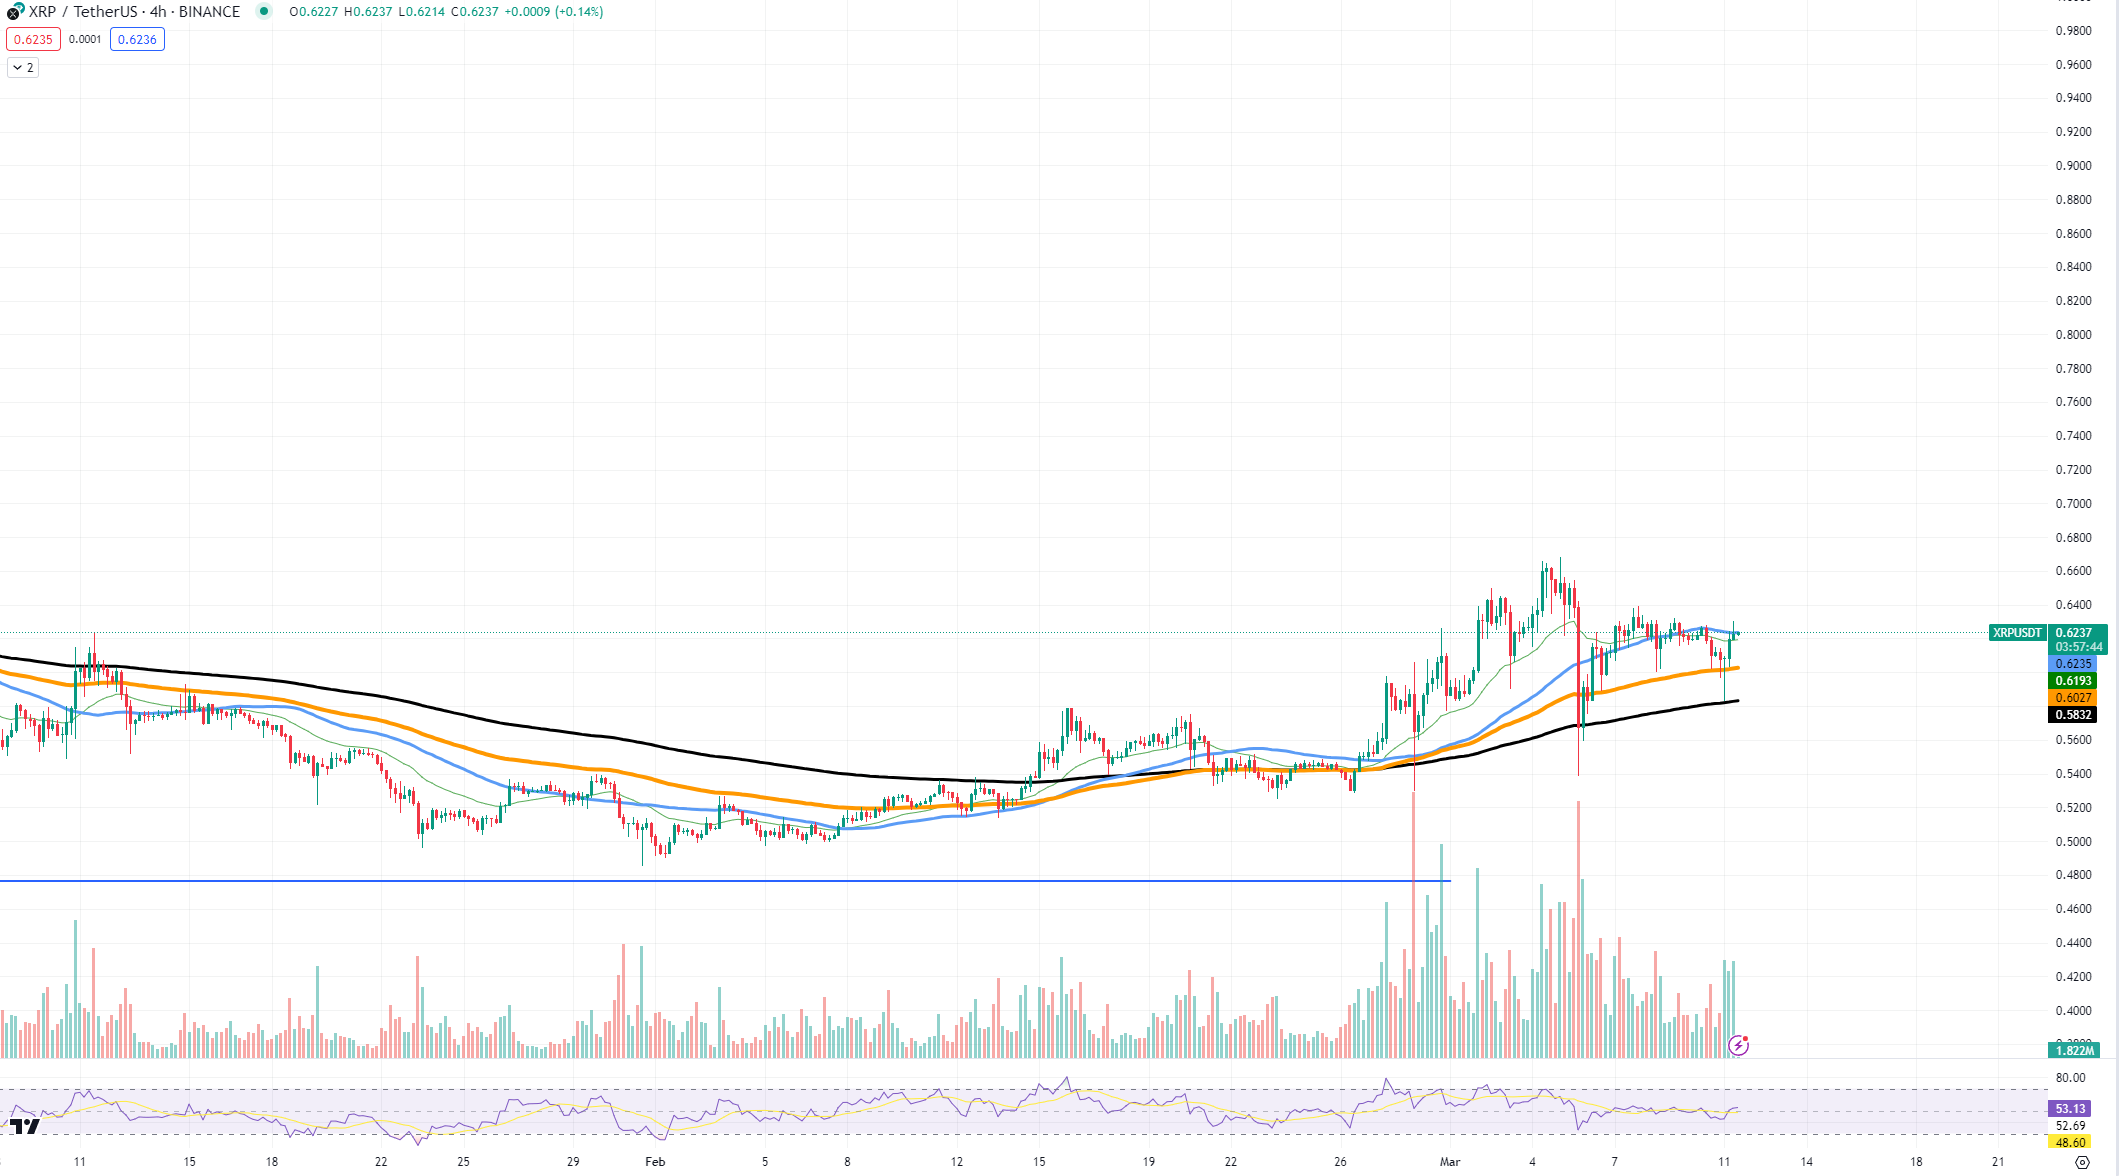
XRP has recently pictured an intriguing technical pattern that could suggest a potential reversal. Known for its rapid price movements, XRP has painted what appears to be an unexpected candlestick formation on the four-hour charts, resembling a spinning top but situated at a bottom rather than a peak.
A spinning top is a candlestick with a small real body and long shadows on both sides, reflecting indecision among traders. This pattern becomes particularly noteworthy when it occurs following a downtrend, as it may indicate the loss of momentum in selling pressure and a possible shift in market sentiment.

In the case of XRP, this pattern emerged at a crucial juncture where the price bounced off the 200-period exponential moving average (EMA).
The strength in this scenario lies in the confluence of the spinning top candlestick pattern with the bounce off the 200 EMA, which could be interpreted as a strong bullish signal, especially on an intraday time frame like the four-hour chart. It suggests that buyers are beginning to counteract sellers, potentially leading to a trend reversal.
On the other hand, the weakness lies in the inherently indecisive nature of the spinning top pattern itself. While it indicates a possible change in direction, it does not guarantee it. Therefore, the confirmation of this potential reversal would require subsequent bullish candlesticks to validate the shift in market dynamics.
Should the pattern indeed signal the commencement of a reversal, we could anticipate an upward trajectory for XRP. Subsequent bullish momentum might propel the price toward the next levels of resistance, potentially reversing the previous downtrend and setting a new higher low.
Conversely, if the pattern fails to induce a reversal, it could merely represent a temporary pause in the prevailing downtrend. The price of XRP might then breach the 200 EMA support, catalyzing further declines as bearish sentiment continues to govern the market.

 Arman Shirinyan
 Alex Dovbnya
 Dan Burgin