Disclaimer: The opinions expressed by our writers are their own and do not represent the views of U.Today. The financial and market information provided on U.Today is intended for informational purposes only. U.Today is not liable for any financial losses incurred while trading cryptocurrencies. Conduct your own research by contacting financial experts before making any investment decisions. We believe that all content is accurate as of the date of publication, but certain offers mentioned may no longer be available.
XRP is currently experiencing what we sometimes refer to as a "squeeze." This technical phenomenon occurs when an asset's price consolidates, leading to a battle between buyers and sellers for control of the market direction in a narrow price range.
XRP's squeeze is evident as the price hovers near a convergence of its moving averages, which are pivotal indicators of both support and resistance. The 50-day moving average (orange line) and the 100-day moving average (blue line) converge around the $0.55 to $0.58 range, creating a crucial zone that XRP must hold to maintain a bullish posture. A breach below this level could signal a bearish downturn, as these averages would then act as resistance.
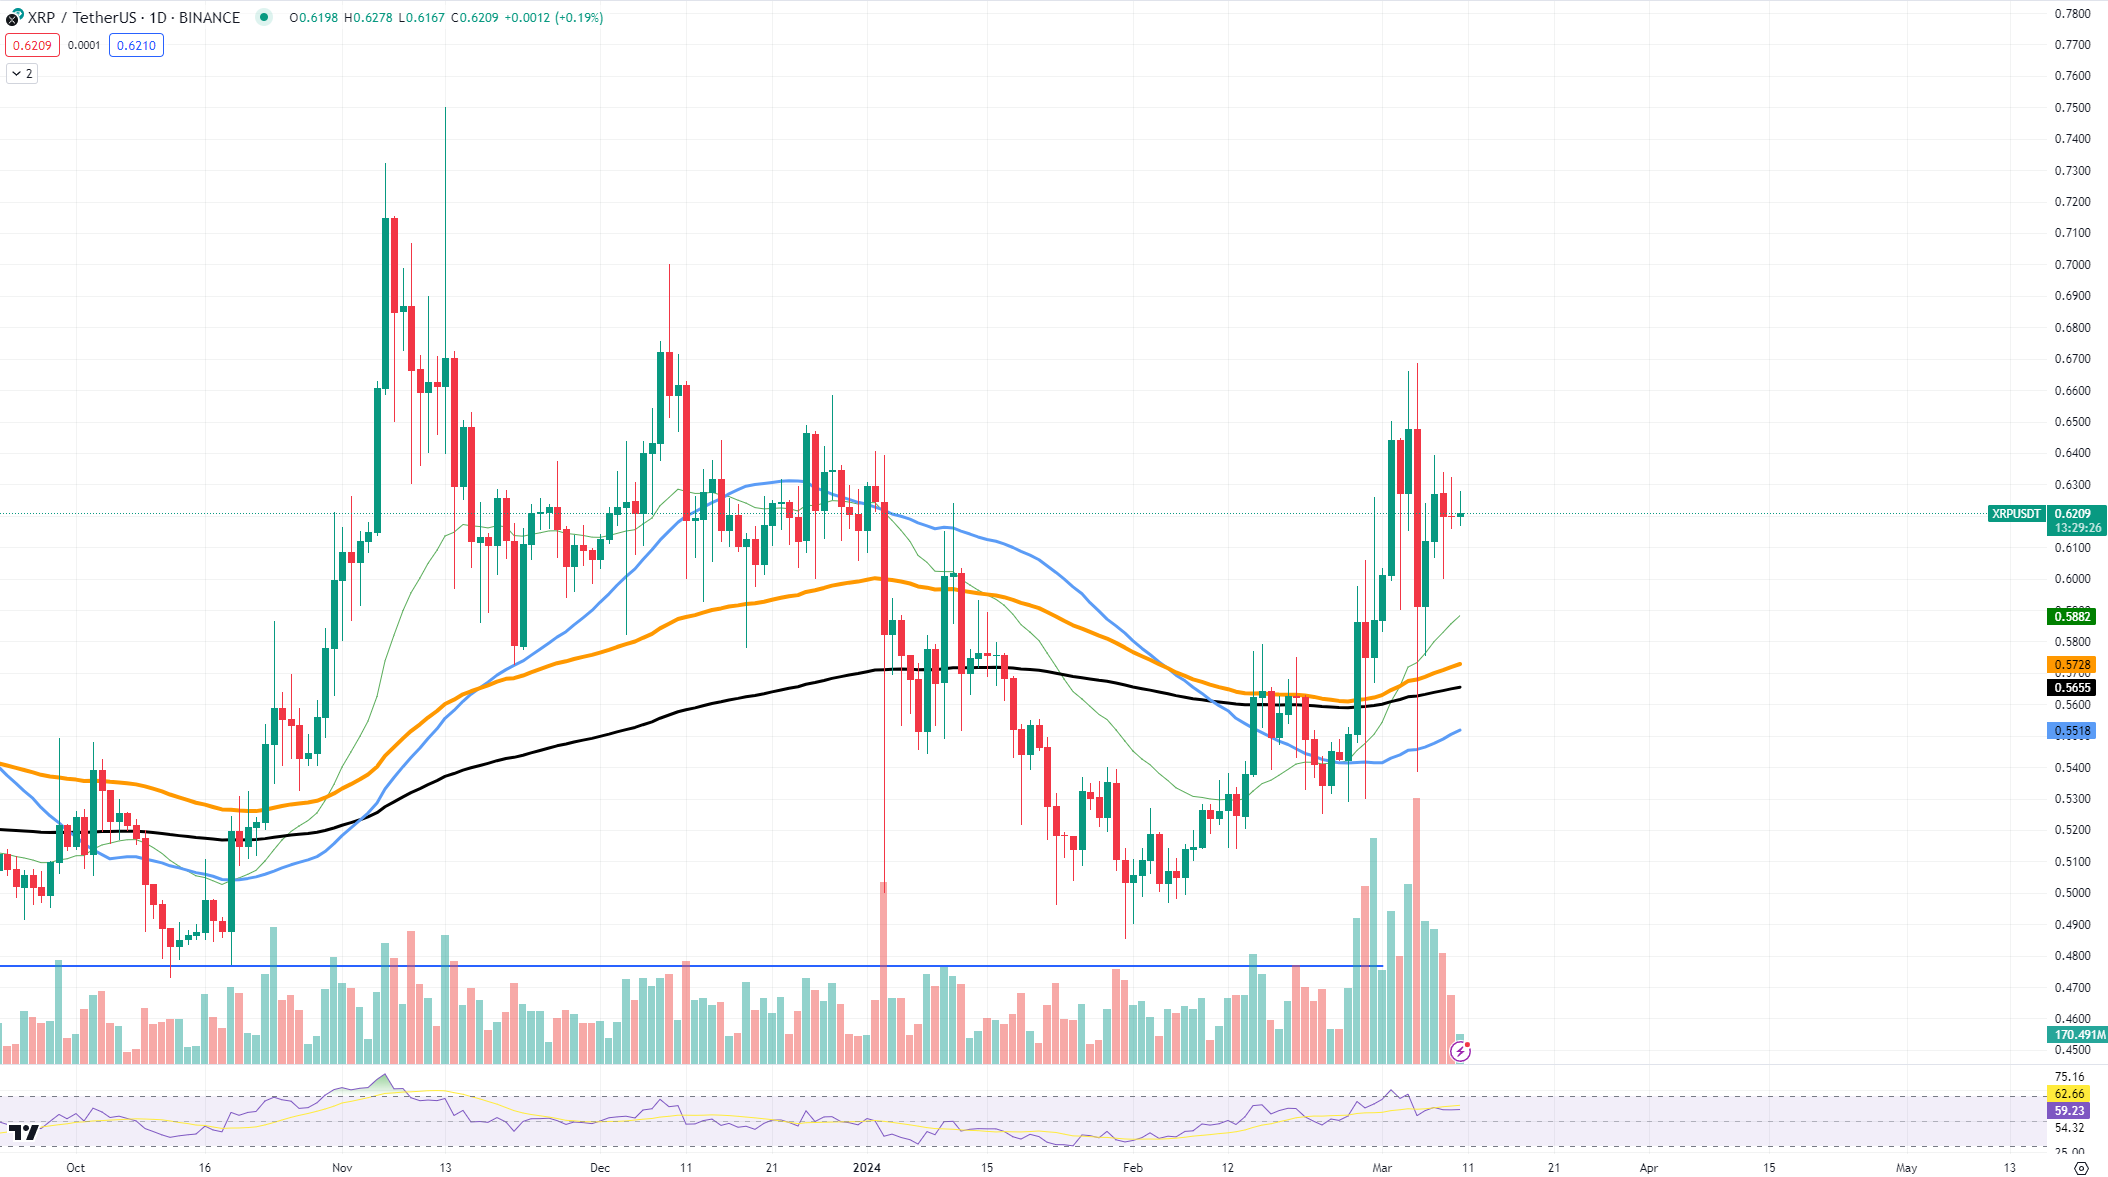
The short-term resistance level for XRP is currently found at approximately $0.63. This level has recently thwarted upward moves, and a breakout above could pave the way for more bullish momentum. Conversely, should XRP's price fail to sustain above the moving averages, the next level of support lies near $0.50, where buyers may step in to stabilize the price.
The possibility of a price reversal exists, especially considering the RSI (relative strength index) is hovering in a neutral zone, reflecting uncertainty in the market. A decisive move in either direction, supported by substantial volume, will likely set the tone for XRP's price in the coming days or weeks.
Major Ethereum test
Ethereum is exhibiting strong bullish behavior as it approaches the pivotal $4,000 price point. This threshold, seen as a significant psychological and technical barrier, is within reach, given the current momentum observed on the TradingView chart. Here, we dissect the possibilities of a breakthrough and the price action surrounding this surge.
The current price chart reveals Ethereum's determined ascent, marked by a series of higher lows and bullish candles. The immediate support for ETH is firmly established around the $3,400 level, which aligns with the 50-day moving average — a key indicator that often acts as a dynamic support in an uptrend. This level has been tested and held recently, suggesting strong buying interest at these prices.

Looking at resistance levels, $4,000 looms large. It is a round number that has historically acted as a tough nut to crack. However, the pressure is building as the volume and price action indicate a consistent demand for Ethereum. Breaking past this level would likely usher in a fresh wave of optimism and potentially trigger a rally to new highs.
A surge toward $4,000 is supported by Ethereum's fundamentals, such as ongoing network upgrades and a vibrant decentralized finance (DeFi) ecosystem. Moreover, as Bitcoin's dominance in the market ebbs and flows, investors often look to ETH as a bellwether for altcoin potential, thus driving up its value.
However, the possibility of a price reversal always exists. The relative strength index (RSI) is currently indicating overbought conditions, which may signal a potential pullback or consolidation before further upward movements. Traders and investors will be monitoring this closely, as any sign of reversal could lead to short-term profit-taking.
Bitcoin at $70,000
Bitcoin is presenting signals that suggest a need for caution despite its recent bullish behavior. Investors and technical analysts are closely monitoring the charts for indications of what may lie ahead for the world's premier digital currency.
As we dissect the BTC/USD pair on TradingView, we find Bitcoin hovering near the resistance level of approximately $69,000. This price point has served as a hard ceiling in recent times, with attempts to break through meeting stiff resistance.

The relentless approach toward this barrier indicates strong bullish sentiment in the market, yet the inability to surpass it may lead to a buildup of selling pressure.
Support levels, crucial for maintaining the current rally, are established around $59,586, coinciding with the 50-day moving average. This moving average has historically acted as a reliable support in uptrends, but a break below could signal weakening momentum and the potential for a broader price correction.
 Dan Burgin
 U.Today Editorial Team