
Disclaimer: The opinions expressed by our writers are their own and do not represent the views of U.Today. The financial and market information provided on U.Today is intended for informational purposes only. U.Today is not liable for any financial losses incurred while trading cryptocurrencies. Conduct your own research by contacting financial experts before making any investment decisions. We believe that all content is accurate as of the date of publication, but certain offers mentioned may no longer be available.
XRP has recently experienced a significant reduction in its volatility, reaching levels that have not been seen for a considerable period. This decline in volatility, combined with the current price behavior, suggests that XRP is undergoing a phase of consolidation, potentially setting the stage for a significant price movement in the near future.
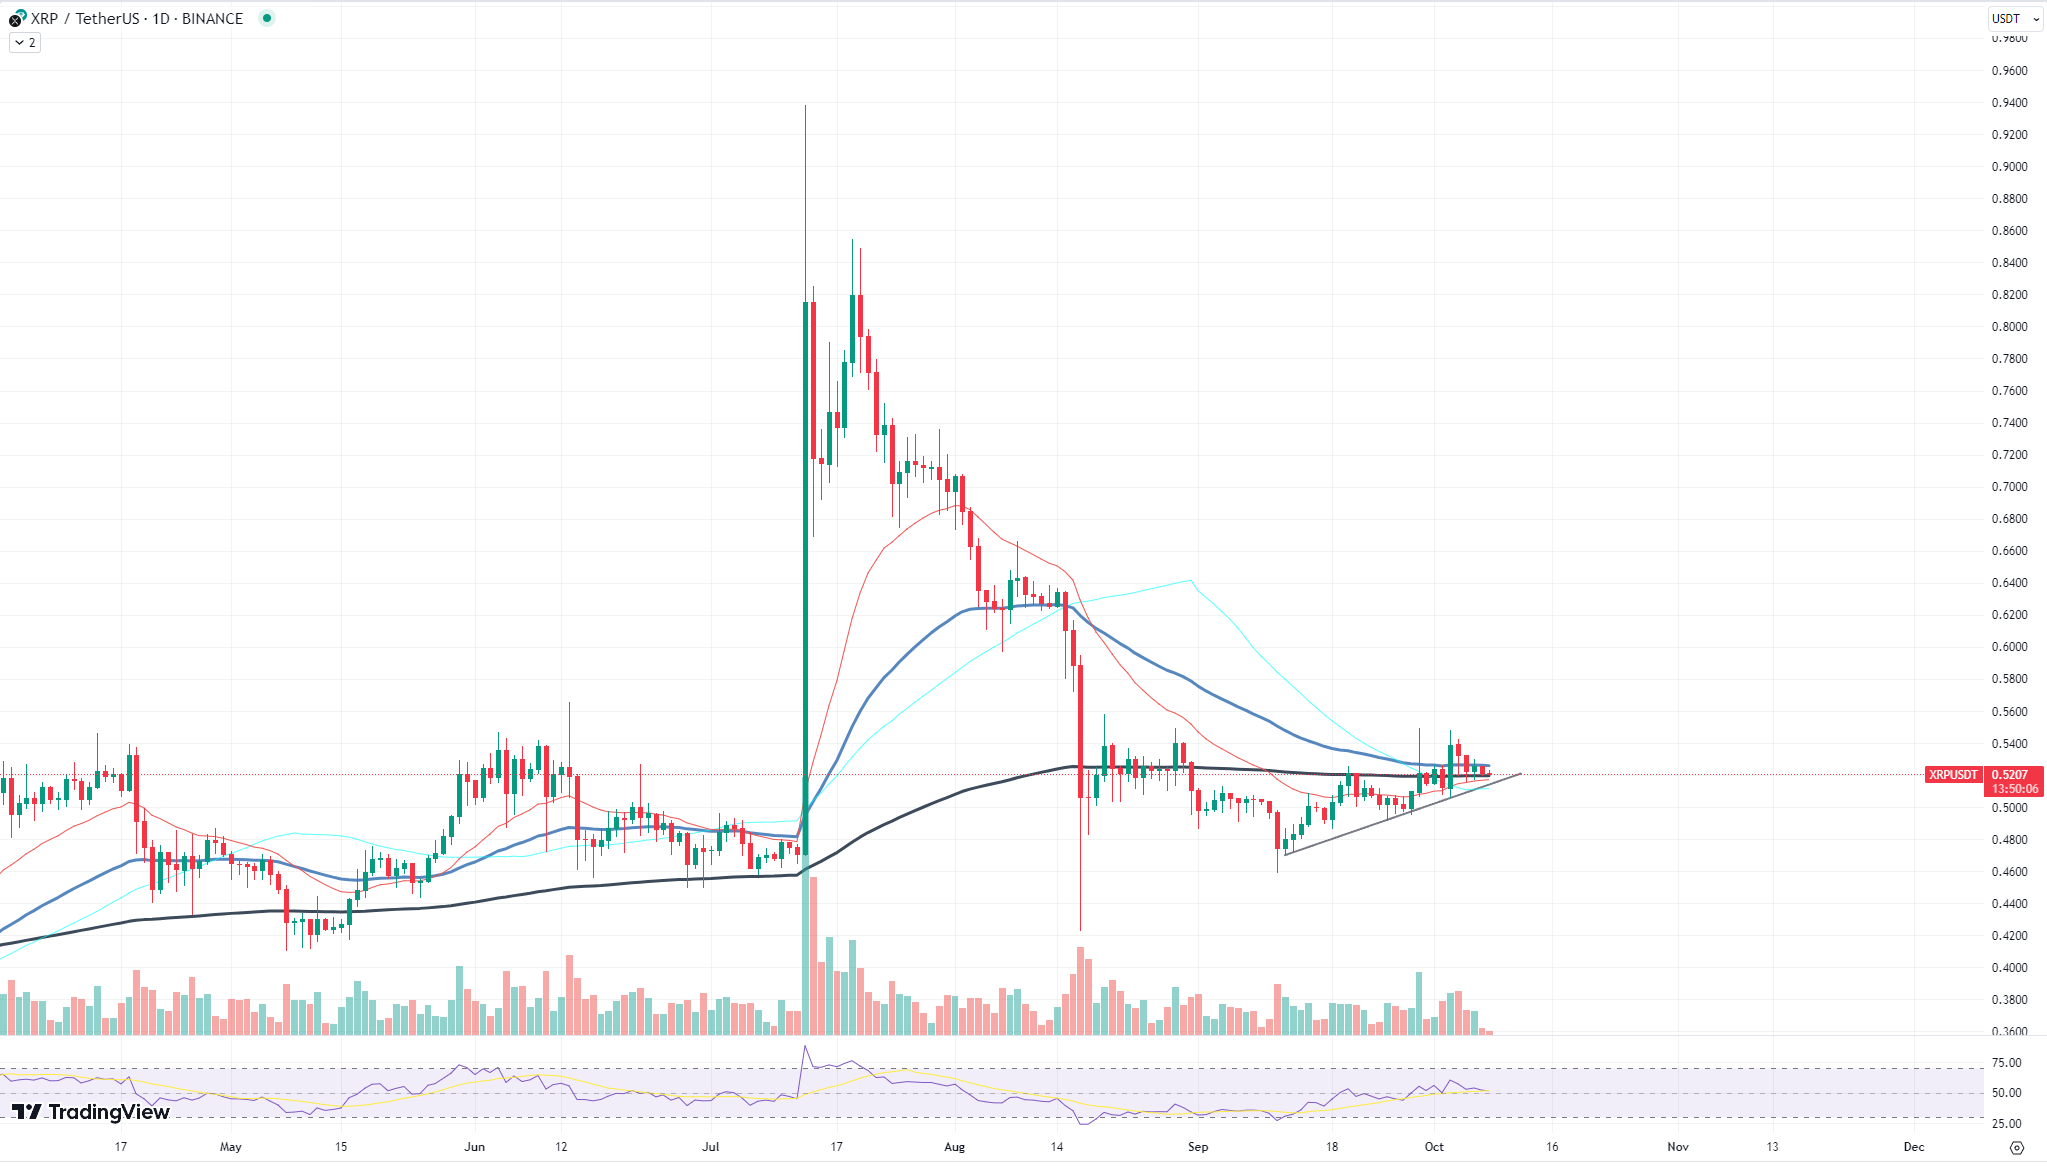
At the time of writing, XRP is trading at $0.5214. Over the past few weeks, the price of XRP has been squeezed between two critical moving averages. This "squeezing" effect is often considered a precursor to a substantial volatility surge, as the asset's price gets compressed between significant support and resistance levels. Historically, when an asset's price gets squeezed in such a manner, it tends to break out in either direction with heightened momentum.

The current price behavior of XRP indicates that traders and investors are in a state of indecision, with neither bulls nor bears taking full control. However, this equilibrium is unlikely to last for long. As XRP continues to hover between these moving averages, the pressure builds up and a breakout becomes increasingly imminent.
Cardano on verge
Cardano (ADA), one of the top-tier digital assets on the market, has once again faced a setback. The digital asset has failed to sustain its position above a crucial resistance level, the 50-day exponential moving average (EMA). This marks the second time ADA has attempted and failed to break above this significant threshold.
As of the latest data, Cardano is trading at $0.2563, which places it near the 21-day EMA. This level could act as a potential support for ADA, but the recent dip below the 50-day EMA raises concerns about its short-term trajectory. The 50-day EMA is often considered a critical indicator by traders and analysts, as it can signify the overall trend of an asset. A sustained position above this level typically indicates a bullish trend, while consistently trading below it can be a bearish sign.

However, not all indicators are pointing toward a gloomy future for Cardano. The trading volume for ADA remains elevated, suggesting that there is still significant interest and activity around the asset. Additionally, the relative strength index (RSI), a momentum oscillator that measures the speed and change of price movements, is hovering around the 50 mark. An RSI value of 50 is considered neutral, neither overbought nor oversold. This positioning could indicate that ADA is in a good position for a potential price reversal in the near future.
Shiba Inu left alone
Shiba Inu (SHIB) is currently facing a challenging phase. Recent observations have pointed to a decrease in the activity of large holders or "whales" in the SHIB market. This reduced activity can be seen as a sign of waning interest or a more cautious approach by significant investors.
Currently, SHIB is trading below a crucial trendline support level, which has historically acted as a foundation for its price. At present, the digital asset is hovering around the 21-day exponential moving average (EMA). This positioning is crucial as the 21-day EMA often acts as a short-term indicator of an asset's price movement. A consistent position below this level can be a bearish sign, indicating potential further declines.
One of the concerning aspects for SHIB's immediate future is the positioning of its moving averages. Typically, when moving averages converge or come close to one another, it can create a "bounce" opportunity for the asset, potentially leading to a price surge. However, in SHIB's case, the moving averages are spaced fairly apart, reducing the chances of such a bounce. This distancing suggests that the asset might continue its current trend without a significant reversal in the near term.
 Dan Burgin