Disclaimer: The opinions expressed by our writers are their own and do not represent the views of U.Today. The financial and market information provided on U.Today is intended for informational purposes only. U.Today is not liable for any financial losses incurred while trading cryptocurrencies. Conduct your own research by contacting financial experts before making any investment decisions. We believe that all content is accurate as of the date of publication, but certain offers mentioned may no longer be available.
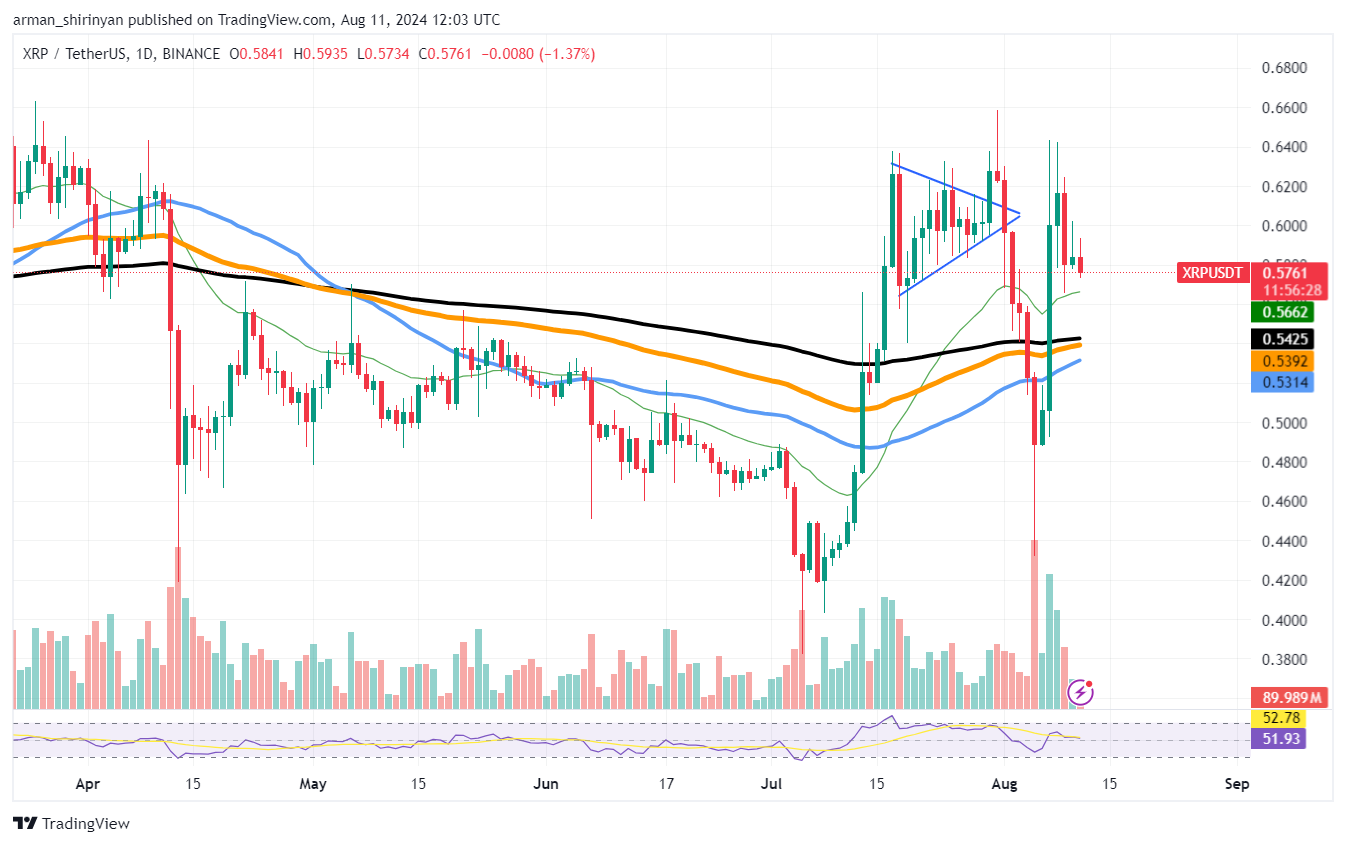
The price of XRP has been gradually approaching the $0.60 level, which if it holds may indicate a more persistent uptrend. Even so there are indications that the uptrend may be waning despite the positive price movement.
A significant worry is the declining trading volume. A robust uptrend is usually accompanied by rising volume, which denotes increasing momentum and interest. There are concerns regarding the sustainability of the recent gains given the current decline in volume, which indicates that fewer participants are pushing the price higher. In addition, the pattern of the chart suggests that a downtrend may be beginning, which could negate the recent upward movement in prices.

Notwithstanding these worries, XRP's performance is still seen favorably especially in light of the potential for a golden cross in the near future. When the long-term moving average crosses above the short-term moving average, it forms a golden cross, which traders frequently interpret as a bullish signal. Owing to the recent explosive price movement of XRP, this crossover may occur earlier than anticipated, boosting market sentiment in a bullish manner.
Shiba Inu loses some ground
Shiba Inu has been making an effort to get better, but things are becoming more and more unstable. A crucial aspect to observe is the declining trading volume, which may indicate that the recent upswing is losing steam.
A decline in volume during an uptrend frequently suggests that fewer traders are backing the price movement, which increases the likelihood of a reversal in the uptrend. The technical signal that indicates the beginning of a downtrend — the crossing of the 100 EMA below the 200 EMA — adds to the pessimistic outlook.
This crossover raises additional questions about how SHIB will recover and raises the possibility that the market is moving in the direction of a longer decline. Currently, SHIB is trading at $0.000014, which is a local resistance level. This level is important because if it is broken it may trigger a stronger upward movement or serve to halt further price increases.
But since the 26 EMA is so close to the current price, it is probably going to serve as additional resistance. Because of the additional pressure created by the EMA's close proximity to the price, SHIB finds it harder to maintain its rally.
Bitcoin volume remains intact
Bitcoin (BTC) has reached a critical turning point as it has encountered the $60,000 resistance level. As the market watches to see if Bitcoin can break through this barrier or if it will experience another setback, this level has proven to be a significant barrier for BTC in recent trading sessions. The $60,000 resistance is a technical as well as psychological barrier.
If this barrier is not broken, sellers may take control and drive Bitcoin's price back toward lower support levels, which could lead to a significant drop in value. Because of this, the present price movement of Bitcoin is crucial to its near-term future. The 50-day EMA, which is posing a strong resistance, is providing additional difficulty. The inability of Bitcoin to break above the 50 EMA could lead to a continuation of the recent downward trend.
The potential consequences of this downward pressure extend beyond Bitcoin and could potentially impact other cryptocurrencies by causing a ripple effect in the cryptocurrency market. To sum up, Bitcoin's short-term trajectory will probably depend on its capacity to overcome the $60,000 resistance and the 50 EMA.
If BTC falls below these levels, the market may experience another decline and altcoins will probably follow. These technical levels should be closely watched by traders and investors in the upcoming days as they may indicate the direction of Bitcoin's and the cryptocurrency market's next significant move.


 Vladislav Sopov
 Dan Burgin