Disclaimer: The opinions expressed by our writers are their own and do not represent the views of U.Today. The financial and market information provided on U.Today is intended for informational purposes only. U.Today is not liable for any financial losses incurred while trading cryptocurrencies. Conduct your own research by contacting financial experts before making any investment decisions. We believe that all content is accurate as of the date of publication, but certain offers mentioned may no longer be available.
The bullish technical pattern known as a golden cross, which can indicate a major increase in the value of an asset, is about to emerge for XRP. When a longer-term moving average like the 200-day EMA crosses above a shorter-term moving average like the 50-day EMA, this is known as a golden cross.
This crossover is frequently taken as a reliable sign of bullish momentum, indicating that there may be preparations for a long-term upswing in the asset. The price performance of XRP appears to be stabilizing on the current chart following some recent volatility. The 200-day EMA and the 50-day EMA are getting closer, which could soon result in the formation of a golden cross.
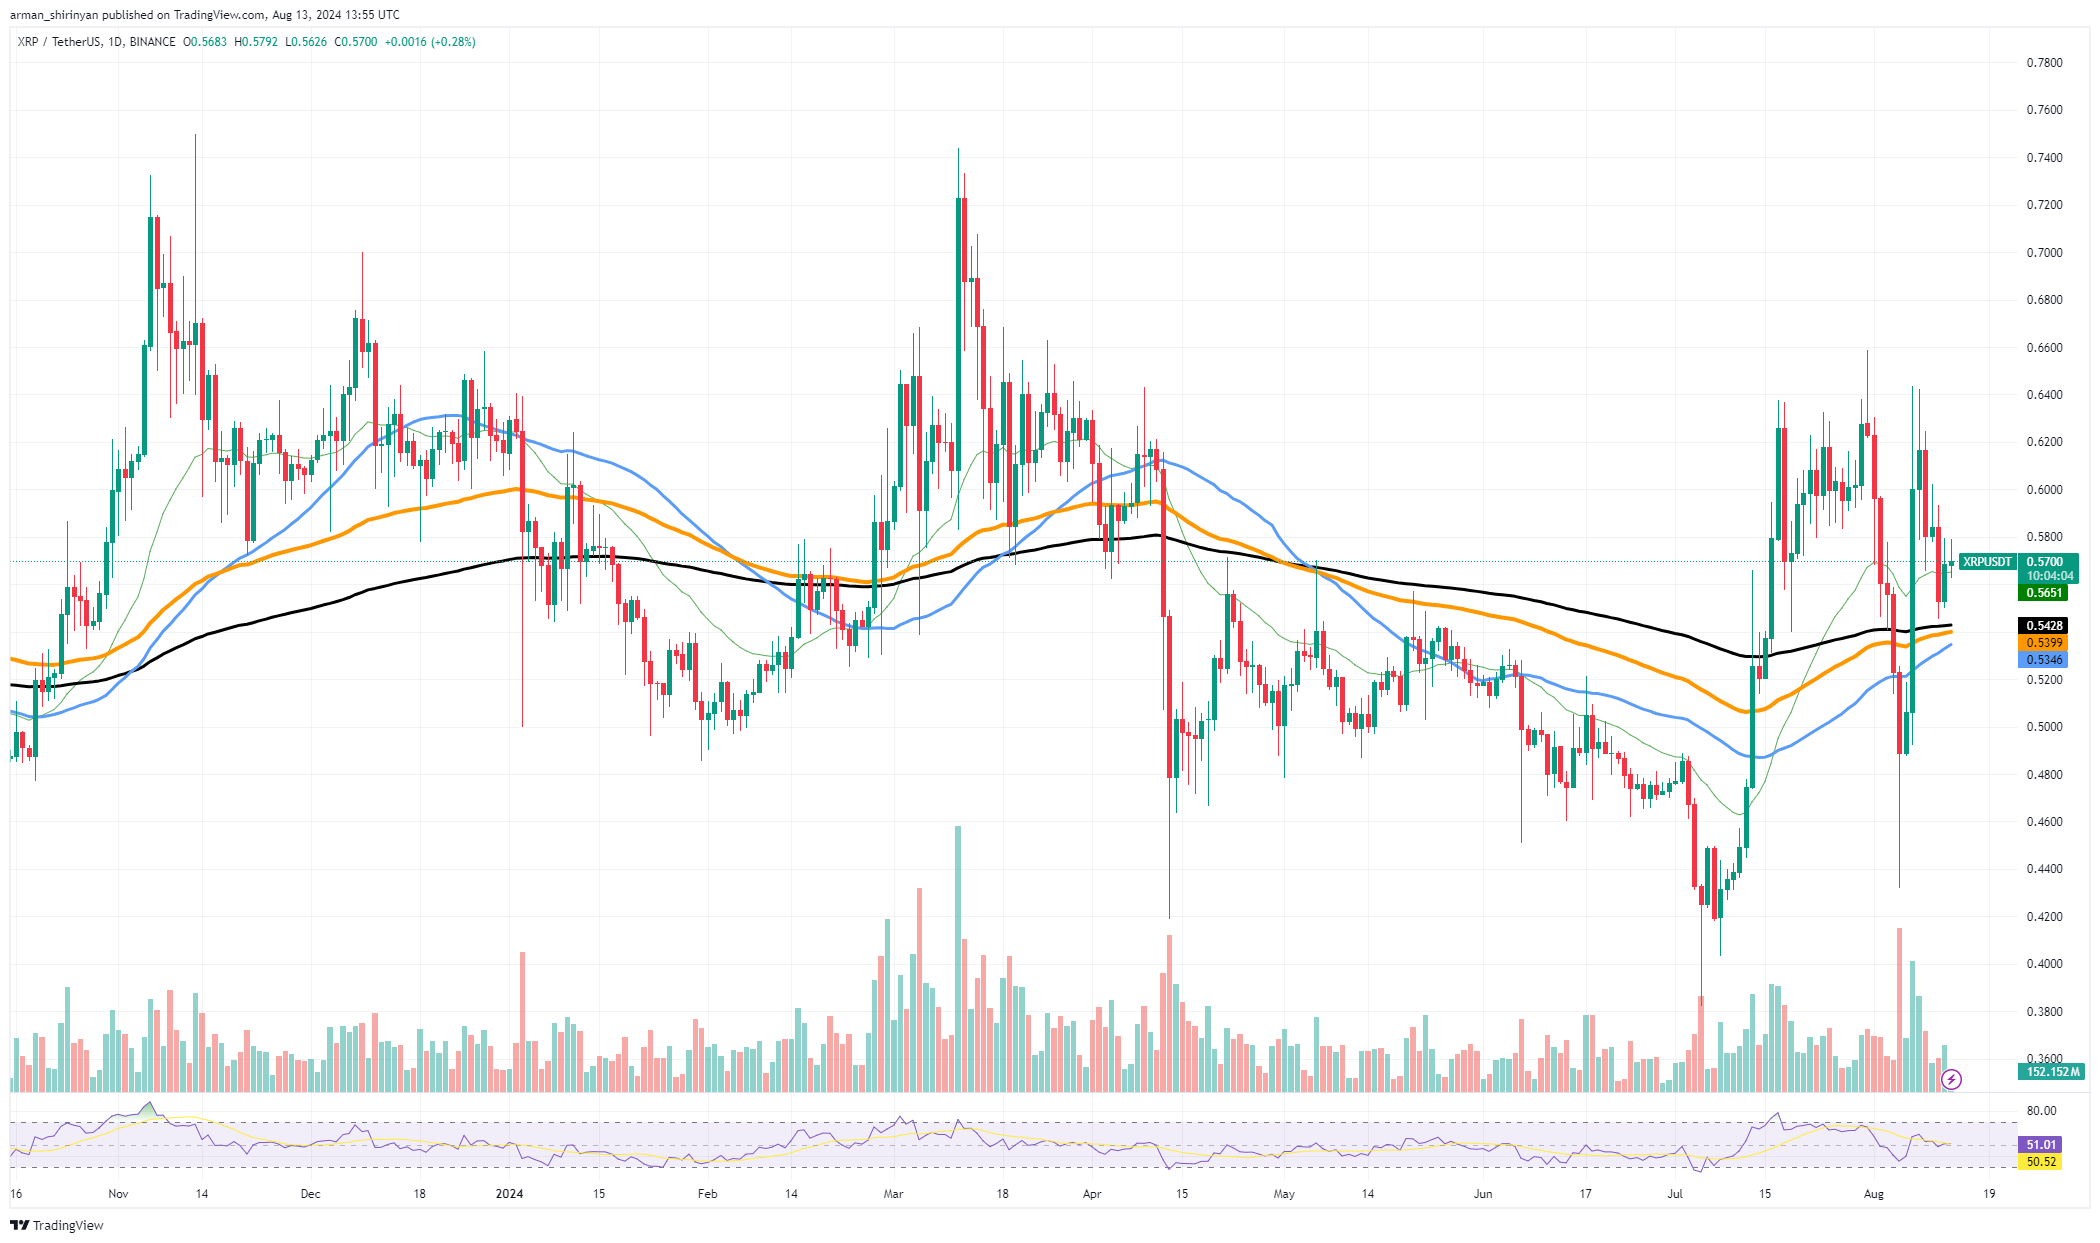
Given that traders frequently use the golden cross as a signal to initiate long positions, if this pattern comes to pass it will probably draw in more buyers. Watch the key levels around $0.5364 and $0.5648 in the upcoming days. A golden cross is more likely if XRP can overcome these resistance levels while the moving averages keep converging. Higher targets such as retesting the $0.60 level and beyond could be reached by XRP if a confirmed golden cross is formed.
But because the market can be unpredictable, it is crucial to exercise caution. Even though it is a bullish indicator, the golden cross is not perfect. The price movement of XRP may still be impacted by outside variables and the general mood of the market. Before taking any action, traders should keep a careful eye on the circumstances and weigh any potential risks.
Shiba Inu remains in trouble
Though the Shiba Inu (SHIB) price has been steadily declining over the last few months, the chart indicates that a possible reversal may be approaching. For traders hoping to profit from the next move, it is essential to pinpoint the critical price levels at which SHIB may experience a shift in momentum.
At the moment, SHIB is trading close to the $0.00001357 mark. Although this area has served as a flimsy support, it has not shown enough strength to start a sustained rebound yet. Watch the $0.0001508 level for more compelling reversal traders. A break above this price could potentially mark the start of a new uptrend by indicating that SHIB has overcome a significant resistance level.

The mark of $0.00001621 is an additional crucial level to monitor. The 50-day EMA, which this price is in line with, may serve as a technical as well as a psychological barrier. In addition to confirming a short-term bullish trend, SHIB pushing past this level would raise the possibility of testing the next major resistance. Underlying this, the crucial support to keep an eye on is the $0.00001000 level.
A decline below this would probably negate any bullish momentum and might trigger additional drops. But the $0.00001824 mark, which represents the 200-day EMA that has historically been a strong resistance point, could be the next significant target if SHIB can sustain its current levels and begin to build upward.
Solana failed to break through
Recent attempts by Solana to break above the $150 mark were thwarted by resistance, which sent the price back down to $144. This rejection at $150 might be the first sign of a possible decline in price, which could see SOL fall below $100. But even though this denial at a crucial resistance level might seem alarming, it is important to take the larger market context into account.
Instead of going into a severe downturn right now, Solana appears to be starting a sideways trend. The price action indicates that although the bears have not yet fully taken control, the bullish momentum has weakened. As of right now, Solana is trading near the $144 mark, which serves as an immediate support level. Should this hold, Solana may consolidate in a range instead of experiencing a large decline.

The market may stay in this phase for some time if SOL does continue to move sideways, with $139 serving as a crucial support and $150 serving as a formidable resistance. Rekindling bearish sentiment and pushing the price closer to $100 is possible if there is a break below $139.
Nevertheless, this scenario appears less likely at this time, in the absence of a significant downward momentum. Conversely, a resumption of the uptrend may be indicated if Solana is able to gather itself and try to break through the $150 resistance again. To predict the likely next move, traders should keep an eye out for price action and volume spikes around these critical levels.
 Dan Burgin
 U.Today Editorial Team