
Disclaimer: The opinions expressed by our writers are their own and do not represent the views of U.Today. The financial and market information provided on U.Today is intended for informational purposes only. U.Today is not liable for any financial losses incurred while trading cryptocurrencies. Conduct your own research by contacting financial experts before making any investment decisions. We believe that all content is accurate as of the date of publication, but certain offers mentioned may no longer be available.
XRP's market performance has recently been characterized by a pronounced downturn, with the asset enduring a 10% decline that compounds its status as one of the most underperforming assets in the cryptocurrency space. The persistence of this trend raises questions about the potential for a recovery and the factors that may influence its future price trajectory.
A critical examination of the XRP/USD daily chart reveals a troubling picture for the asset. After struggling to maintain its ground, XRP has breached several key support levels. The current price hovers around $0.546, with immediate resistance forming near the $0.55 mark. The moving averages have taken a downward turn, indicating that the bearish momentum is gaining strength.
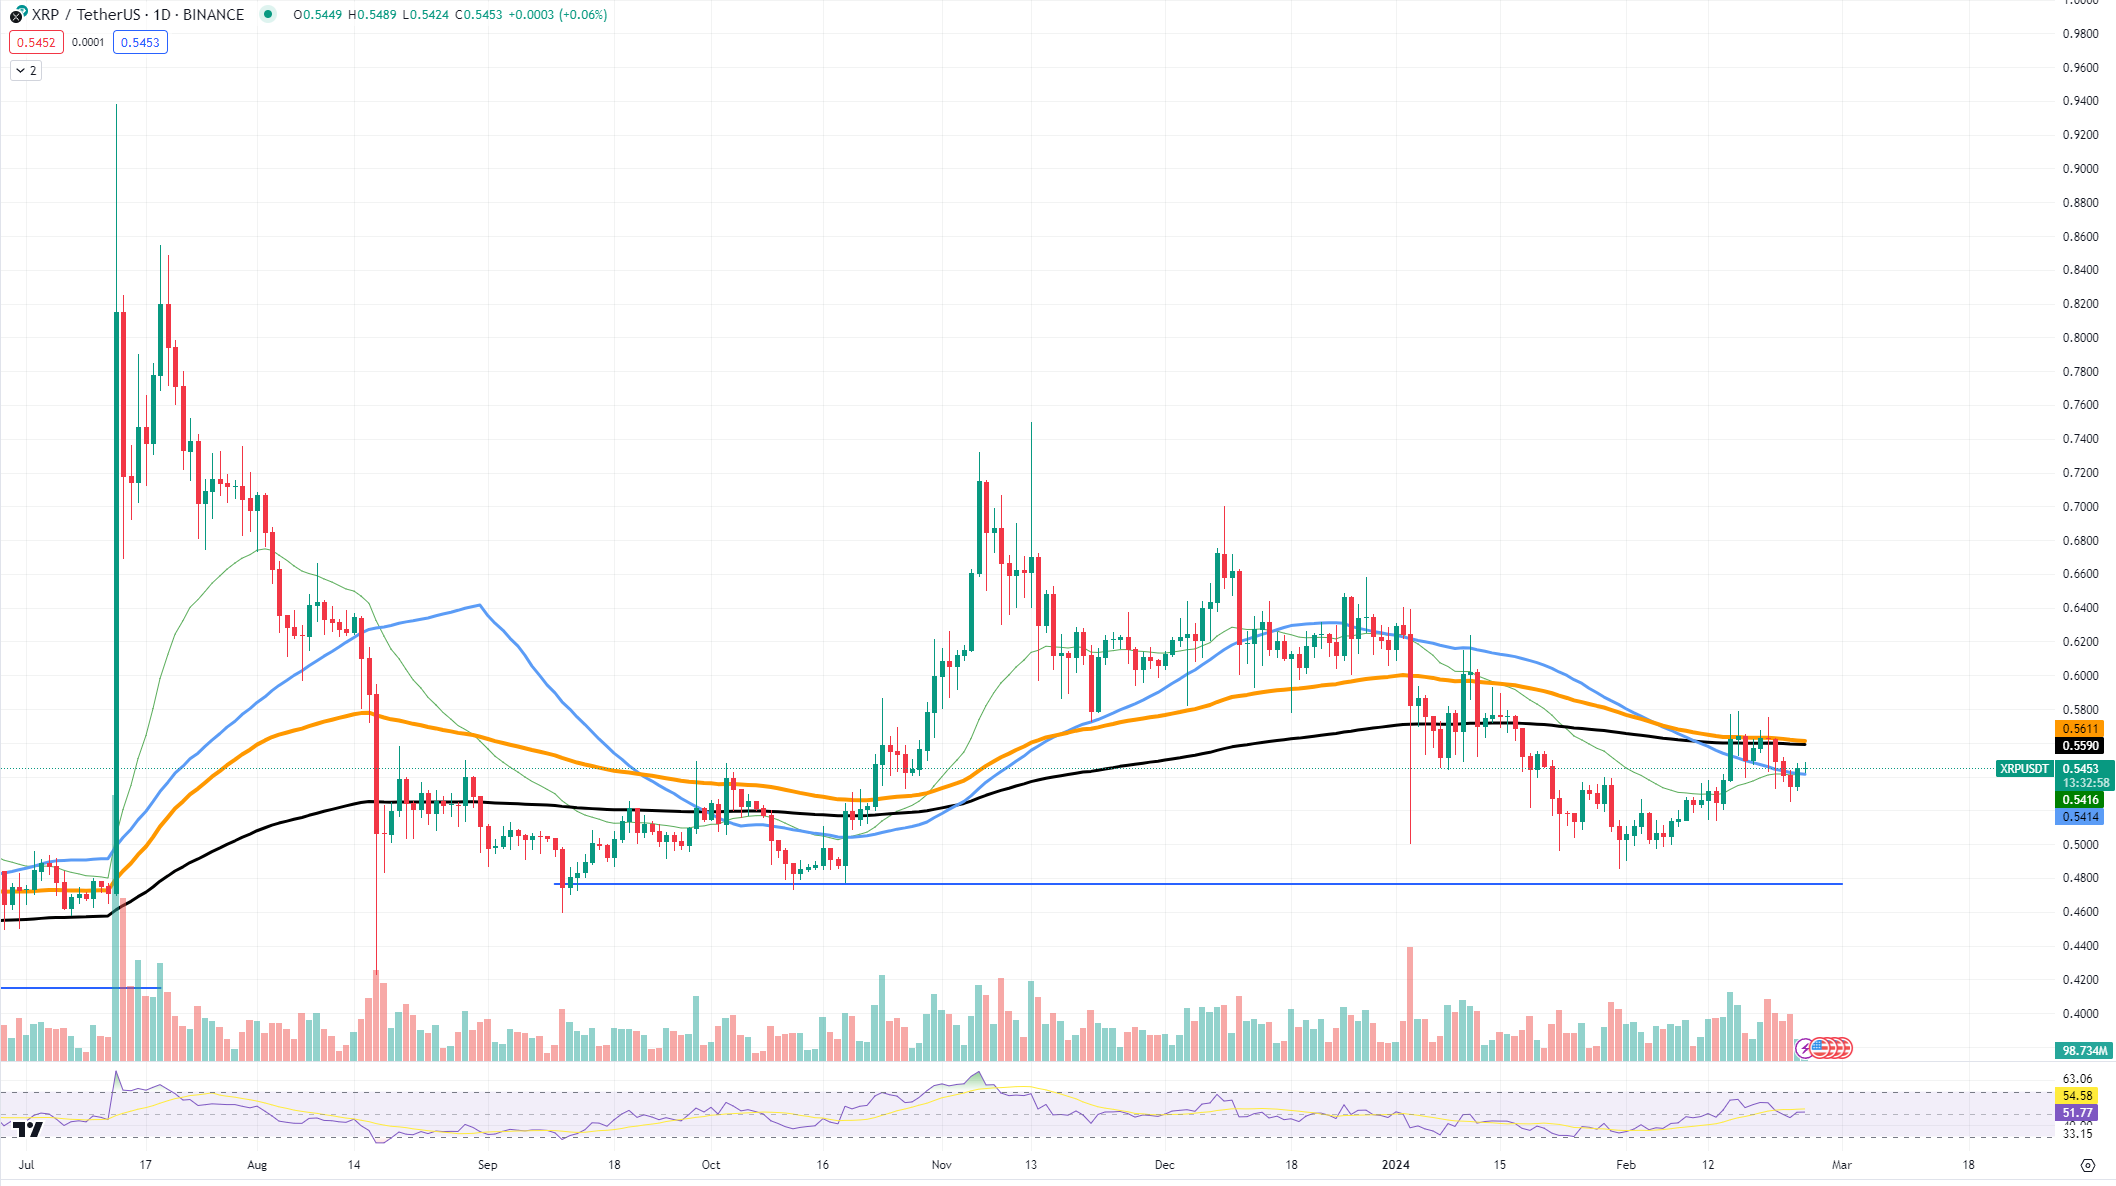
Support levels that once reinforced XRP's value have been consecutively broken, with the next significant support zone lying at the $0.50 psychological level. If this threshold fails to hold, it would likely open the door for further descent, with potential targets near the $0.48 and $0.45 levels, where buyers may step in to stall the decline.
On the other hand, if XRP were to initiate a recovery, it would first need to reclaim the $0.55 level and sustain upward movement to challenge the $0.58 resistance level. A bullish scenario would require a significant shift in market sentiment or positive catalysts, such as favorable news from Ripple's legal front or new, impactful partnerships. Such developments could inject optimism into the market, potentially reversing the downtrend.
However, the bearish scenario seems to be the dominant narrative for XRP at present. The volume profile shows an increase in selling pressure, and the relative strength index (RSI) has yet to reach oversold territory, suggesting that there may be room for the price to fall further before a substantial number of traders consider it undervalued.
Solana stays suppressed
The SOL/ETH chart presents a stark visual of Solana's (SOL) recent market performance. The pair, which pits the value of Solana against Ethereum, has seen SOL lose significant ground, showcasing a price trend that suggests a considerable downturn in investor confidence.
The SOL/ETH daily chart reveals that SOL has been on a steady decline. This downturn can be attributed to a variety of factors, including overall market sentiment, shifts in investor priorities and possible internal ecosystem challenges.

The chart indicates that SOL's price has plummeted below key moving averages, a bearish indicator for traders who rely on these metrics to gauge market momentum.
At the current juncture, SOL is facing substantial resistance at the 0.00396 ETH level, struggling to make upward moves that could signal a change in trend. The support levels that once provided a floor for SOL's value are now distant memories, with the next significant level of potential support not visible until the 0.00350 ETH mark. If this level fails to hold, the descent could continue, finding its next foothold potentially at the 0.00320 ETH range.
Ethereum stays dominant even at $3,000
Ethereum (ETH) stands out with its resilient performance, particularly as it sustains its foothold above the $3,000 price level. This psychological and technical benchmark has proven to be a bastion of support, underscoring the considerable strength ETH has demonstrated in recent trading sessions.

The ETH/USD daily chart reveals that the second-largest cryptocurrency by market capitalization is in the middle of an unstoppable rally. The price trajectory has been steep and unwavering, with ETH maintaining a bullish stance that has yet to succumb to a proper correction. The consistent series of higher highs and higher lows signals robust buying interest and a positive sentiment among investors.
The current trend analysis showcases Ethereum soaring above all moving averages, with the 50-day moving average serving as a dynamic support that the price has respected throughout its ascent. The 20-day moving average is also trailing closely, adding another layer of support that bolsters the bull case. Resistance levels have been shattered one after the other, and the current price action suggests that ETH is poised to test higher resistance zones, potentially eyeing the $3,200 level next.
 Dan Burgin
 U.Today Editorial Team