Disclaimer: The opinions expressed by our writers are their own and do not represent the views of U.Today. The financial and market information provided on U.Today is intended for informational purposes only. U.Today is not liable for any financial losses incurred while trading cryptocurrencies. Conduct your own research by contacting financial experts before making any investment decisions. We believe that all content is accurate as of the date of publication, but certain offers mentioned may no longer be available.
As the cryptocurrency market enters a period of consolidation and reevaluation, Ethereum's anticipated march toward the $5,000 mark seems to have paused. Investors are progressively derisking their portfolios, perhaps in anticipation of further market turbulence. The current sentiment is not necessarily a harbinger of doom but may suggest a strategic pullback.
Ethereum's chart suggests it is in the throes of a natural correction. After a sustained period of growth, marked by a series of higher highs, the price appears to be retracing toward key support levels.
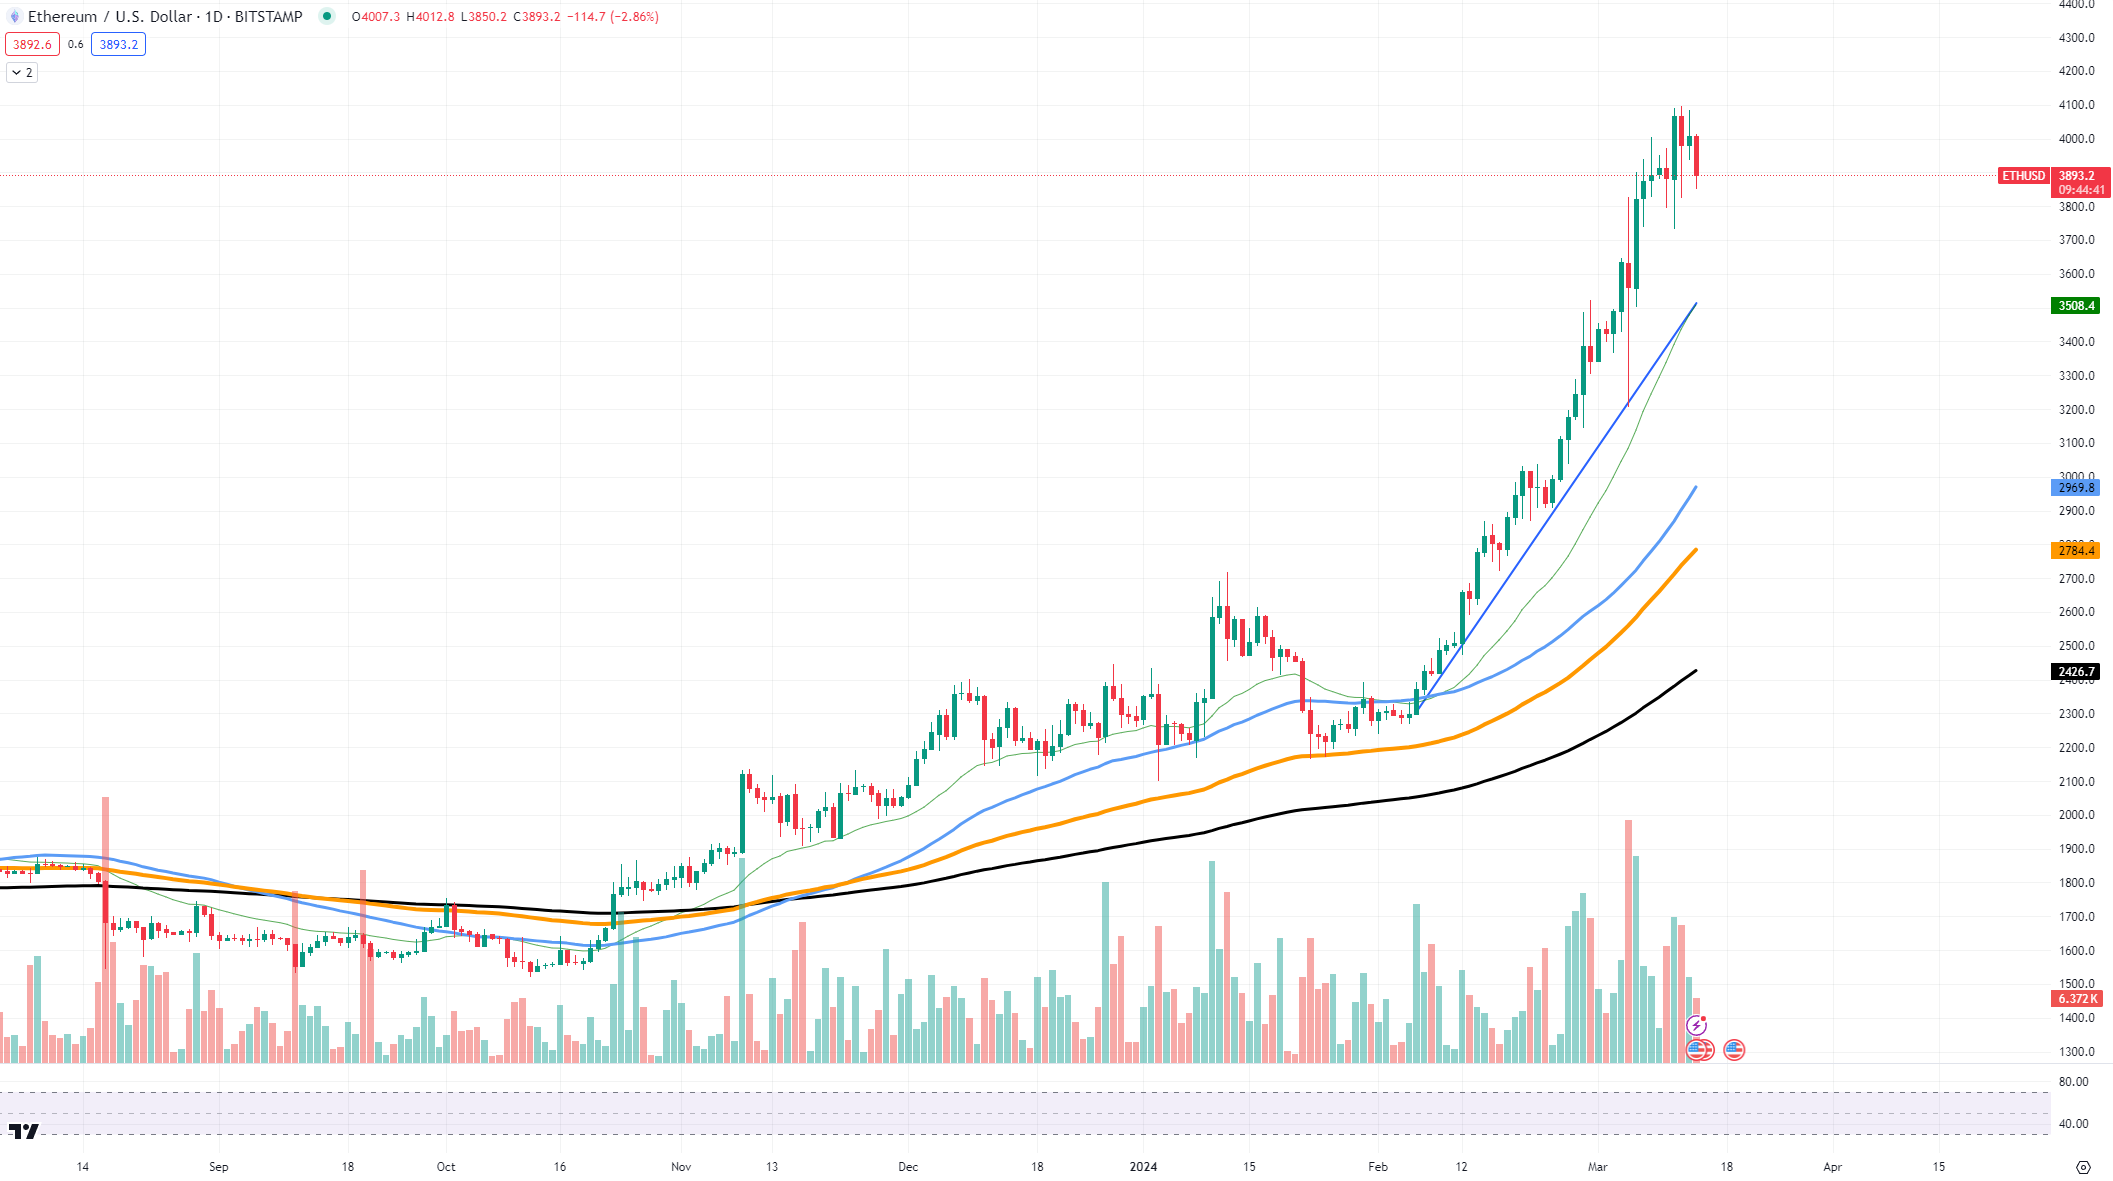
These pullbacks are healthy in a bull market, allowing the asset to gather the necessary momentum for the next leg up. Technical indicators such as moving averages, which have provided support throughout the rally, are now being retested.
This cooling-off phase is characterized by a reduction in trading volume, indicating a decrease in immediate buying pressure. It also reflects the broader market sentiment, where the fear of a significant downturn prompts investors to lock in gains, resulting in a self-fulfilling prophecy of a temporary downtrend.
Bitcoin's path to $80,000
Bitcoin is approaching the psychological barrier of $80,000, but the current state of the market might not let it go through.
Bitcoin's recent trajectory shows a climb toward this unprecedented level, with the asset exhibiting strong support near the $62,000 range. This support level is bolstered by the 50-day moving average, which historically acts as a dynamic foundation during bullish trends. The ascent has been accompanied by increasing trading volume, suggesting that the rally has substantial market participation and is not solely driven by speculative action.

As BTC flirts with the $80,000 mark, resistance has formed near the $74,000 zone, where profit-taking has caused price retracements. The current price action indicates that Bitcoin is consolidating gains, often a prelude to a more decisive move. The resistance zone needs to be watched closely, as a breakout above it could signal the continuation of the bull run, whereas failure to breach could result in a price reversal.
Furthermore, the RSI is hovering near overbought territory. This suggests that Bitcoin could be due for a temporary pullback as traders take profits and reassess their positions. A reversal from these levels may not be a full-fledged bearish turn but rather a healthy correction allowing the market to stabilize before its next leg up.
The path to $80,000 is fraught with both anticipation and skepticism. If the local support levels hold steady amid market fluctuations, Bitcoin could potentially consolidate its position further, creating a launchpad for the coveted $80K target. However, if support falters, the asset may experience a sharper decline as part of its cyclical nature.
R0ally's dark horse
While the limelight has been on assets like Ethereum (ETH), Dogecoin (DOGE) and Shiba Inu (SHIB), Binance Coin (BNB) has executed a stealthy 40% pump. BNB is often overlooked in favor of more media-centric cryptocurrencies, despite its robust fundamental use case and the utility within the Binance ecosystem.

The BNB chart reveals that the token has experienced significant bullish momentum, with a series of higher lows and higher highs indicating a strong uptrend. The price has recently rallied to a resistance level at around $600, which was previously untested, suggesting that traders are exploring new valuation territories.
Local support levels for BNB can be identified near the $450 mark, where the 50-day moving average lies. This moving average has historically provided a dynamic support level during pullbacks, signaling areas where buying interest resurfaces. Moreover, the trading volume has seen a notable increase during the pump, implying genuine investor interest rather than a speculative spike.
 Dan Burgin
 U.Today Editorial Team