Disclaimer: The opinions expressed by our writers are their own and do not represent the views of U.Today. The financial and market information provided on U.Today is intended for informational purposes only. U.Today is not liable for any financial losses incurred while trading cryptocurrencies. Conduct your own research by contacting financial experts before making any investment decisions. We believe that all content is accurate as of the date of publication, but certain offers mentioned may no longer be available.
As investor sentiment shifts globally, the Dollar Index (DXY) has continued its losing streak and entered a steep downward spiral, breaking below important support levels. With a significant intraday increase of 1.48%, Bitcoin is demonstrating strength and resilience in the meantime, reaching $85,885.
This dollar-to-BTC performance difference begs the well-known question: is the two assets' inverse correlation still in place? According to the charts, the DXY has fallen below 100 for the first time in several months, raising serious concerns in conventional financial circles. International trade repositioning, changing interest rate expectations and macroeconomic uncertainty are probably the main causes of the dollar's collapse in strength.
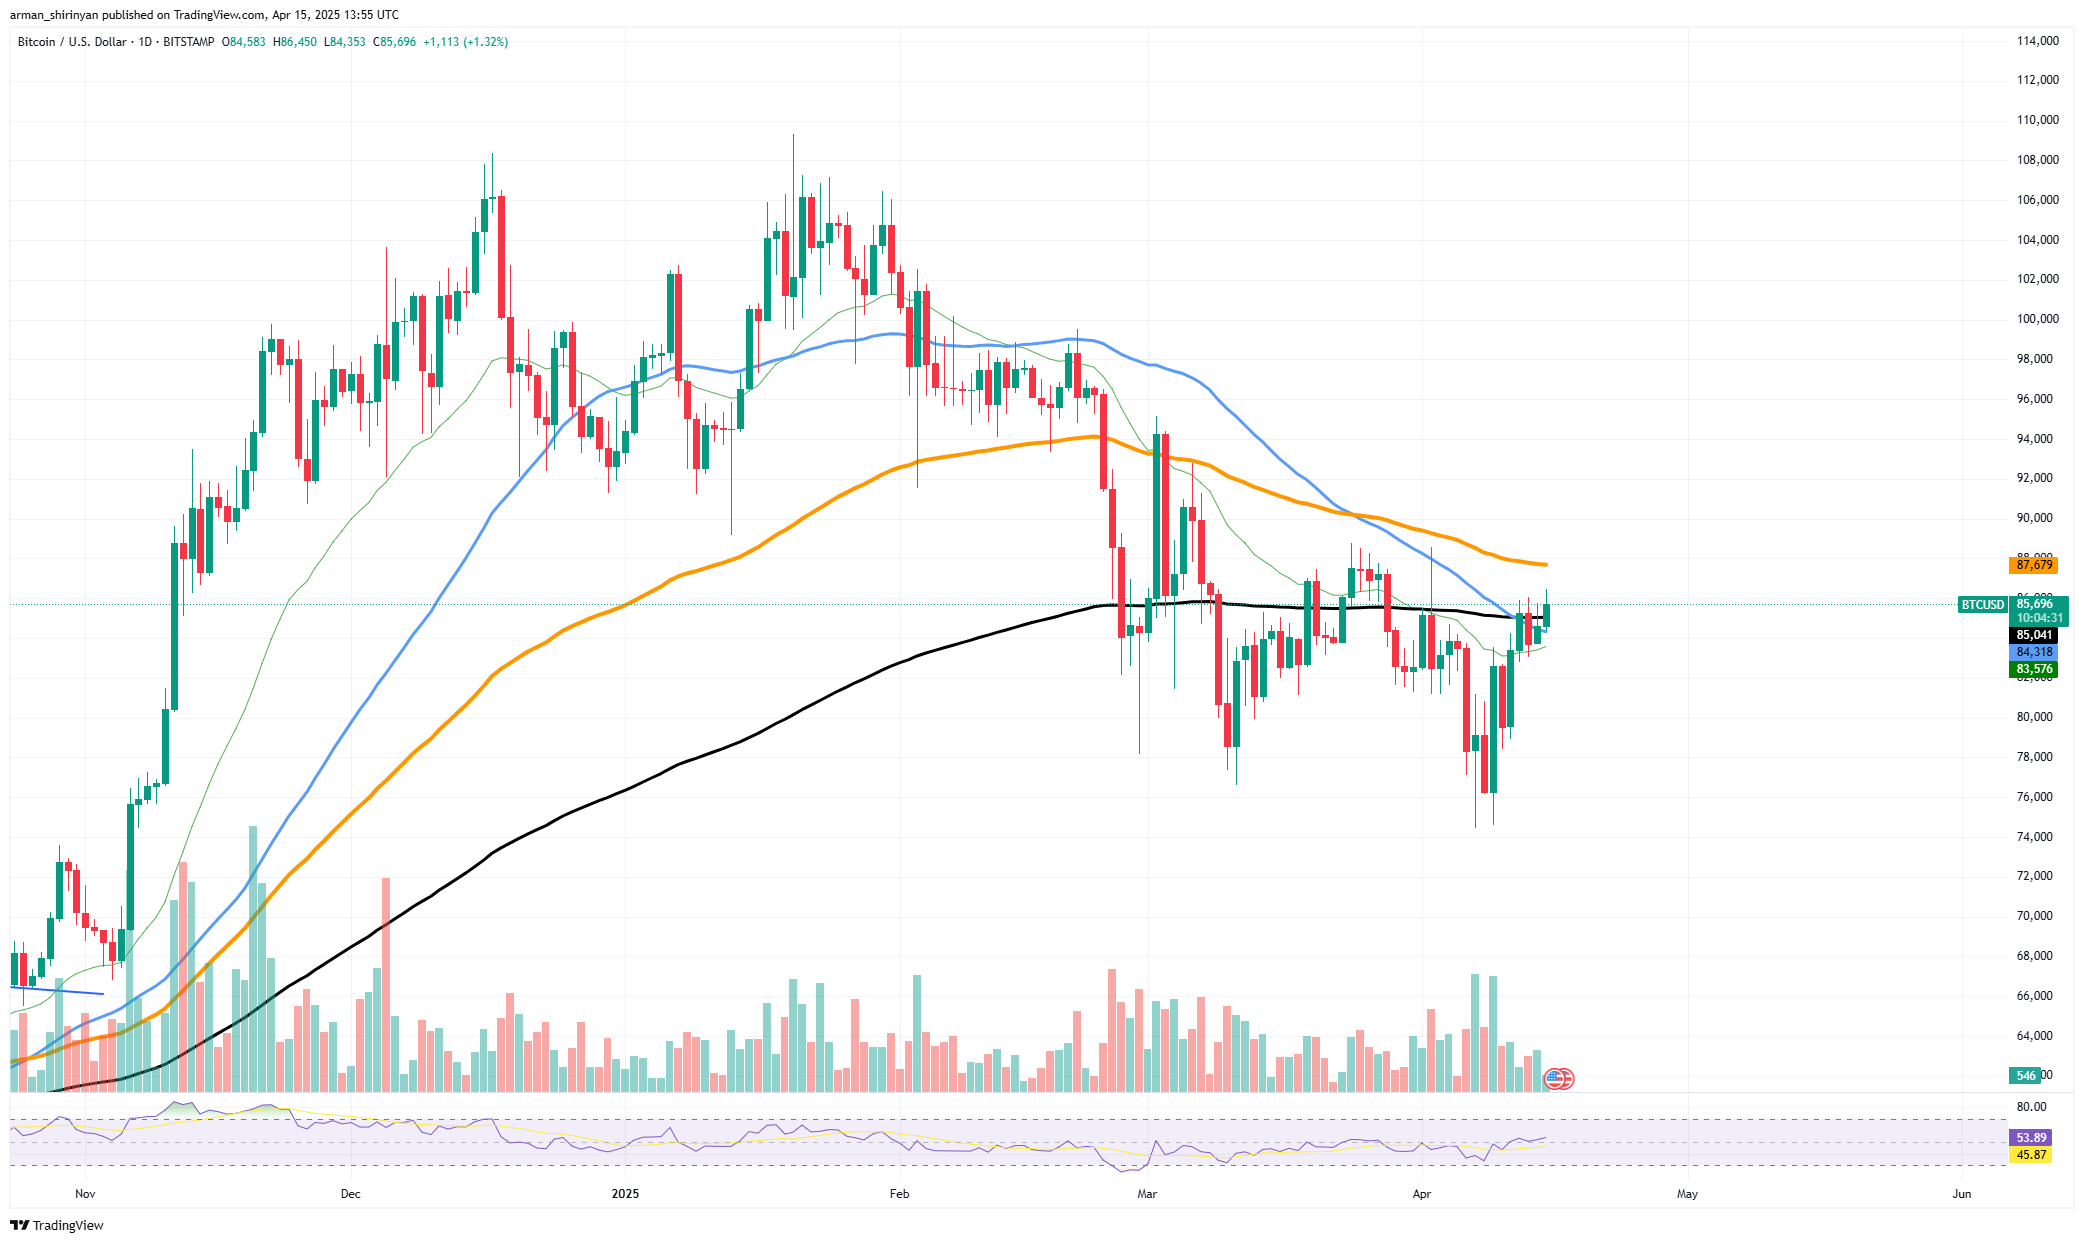
The DXY's RSI has fallen far into oversold territory, suggesting that a technical bounce in the index may be imminent, but it has not happened yet. Bitcoin has been gaining traction, however. Important EMAs, especially the 50- and 100-day averages, have been gradually regaining, and it is currently approaching the 200-day EMA, which is a significant psychological barrier at about $87,000.
Bitcoin's recent surge coincides with an increase in trading volume and a rise in investors' willingness to take on more risk. In the past, there has been a somewhat inverse relationship between BTC and DXY: when dollar strength declines, riskier assets like Bitcoin tend to increase. It seems like that pattern is recurring.
A declining dollar increases the appeal of alternative value stores like Bitcoin, particularly in light of future U.S. monetary policy. As the DXY continues to decline, all eyes are on whether Bitcoin can maintain this breakout. More capital rotation into cryptocurrencies could result from the divergence if it persists, particularly from investors fleeing fiat devaluation.
Solana riding wave up
With a gain of 1.76% for the day, Solana is currently riding a short-term bullish wave rising to about $131. A steady build-up of momentum has been indicated by the asset's consistent movement within an ascending trendline over the last few sessions. But this rise is now getting close to a critical turning point, and a break below the trendline could quickly push SOL below $130, highlighting the final significant support zone around $116.
Technical indicators indicate that SOL's recovery has mostly been driven by momentum as volume has increased significantly enough to support strong institutional or retail support. The absence of volume support could intensify downward pressure if this trendline breaks. The RSI is still neutral but marginally higher, allowing for a quick reversal of momentum in selling pressure.

Even with a shaky technical background, Solana's overall story is getting a boost from Bloomberg ETF analyst Eric Balchunas, who recently confirmed that Canada will introduce a number of spot Solana ETFs on April 16. Leading asset managers such as Purpose Evolve CI and 3iQ will issue these funds, which have been approved by the Ontario Securities Commission (OSC).
These ETFs are unique in that they allow SOL staking, which no U.S. -based ETF currently provides. This move places Canada at the forefront of altcoin ETF innovation and could establish a standard for future cryptocurrency investment vehicles on international markets. The true test will be whether Solana can maintain its upward momentum, even though the ETF news may continue to improve investor sentiment in the near future. The 100 EMA could be retested around $154 if the resistance range of $135-$140 is broken. However, everyone's attention is still on the trend.
Dogecoin aims high
A short-term ascending trendline that has been a dependable support level for the previous few trading sessions has allowed Dogecoin to rise just above the $0.16 mark. But this upward trend is beginning to appear shaky, and a break below this trendline might expose the asset to significant downside pressure, which could push DOGE below the $0.14 support level.
With support located just below the trendline and resistance looming close to $0.167, Dogecoin has been trading in a rather narrow range, according to the chart. In addition to shattering the current bullish structure, a decline below this trendline would give the market a clear bearish signal. The next significant support area, which was previously a strong bounce area but might not hold if selling pressure picks up speed, is located around $0.10. DOGE faces a challenging future.

While major moving averages, especially the 100 and 200 EMAs, are still trending downward and hovering above $0.21, key resistance zones at $0.167 and $0.18 have already rejected the asset several times. Any bullish move is probably going to be short-lived until those are cleared with a lot of volume.
Given that the Relative Strength Index (RSI) is close to the neutral zone, either direction of movement is possible. Trading volume is still low, though, indicating that neither bulls nor bears are very confident. Because of the increased uncertainty, it is even more important to keep an eye on the current trendline.
 Dan Burgin