
Following last night’s craziness among altcoins, Litecoin has managed to grow by 7% and regained its price positions. Now, traders come up with new, even more optimistic forecasts. What do TradingView experts think about Litecoin prospects in the short term? Let’s read LTC price predictions and look at LTC price charts – the picture is beautiful.
Pump or dump? LTC is still deciding on it
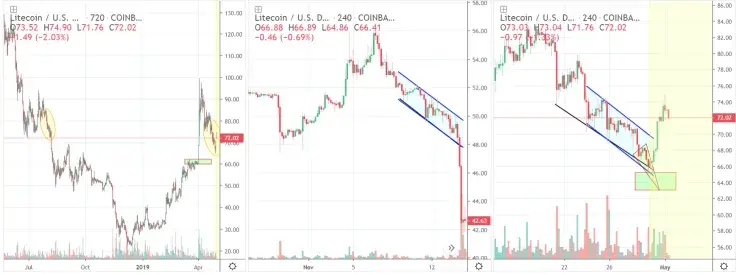
Alts have been very weak these past weeks compared to Bitcoin, which is, in general, a bad sign for the mid/long term. LTC has been moving above a support line (look at the chart on the right). It doesn’t remind us of a wedge or a channel, but at least we can see it has a support line. Candles shift all the time in this market, making it difficult to trade on supports and resistance breakouts.
User botje11 claims that if we do not bounce up after a break of that support line, it might just be very hard. On the left chart, the situation looks a bit the same, even though it was during a clear bear trend. This time it's more like a correction of a good rally. So the bullish outcome from this is possible. Do not expect a very big rally – hope for at least a bounce up to $80. Let’s see whether LTC stays above $62. That means that another drop might happen, so if that one doesn't drop below the green box, it could work out.
We can continue to find possible support levels around $55-$50, as well. If a dump happens in BTC, it would probably mean a dump in LTC as well. Maybe we can see a small wedge (yellow) take form. If that's the case, it would be ideal because then we have something easy to follow.
Get ready for the Lite off
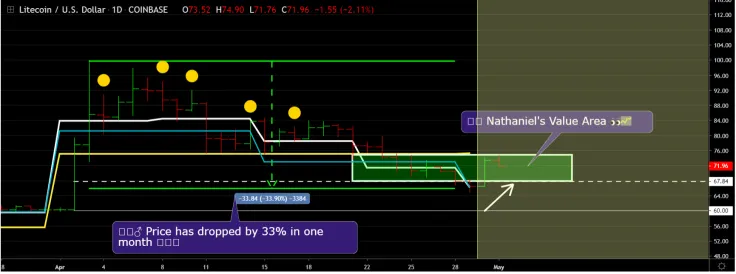
If we take a closer look at LTC, we can see that since the start of the month we have had a 33% drop in price from the high at $100. Looking closer at the charts, the trader concludes that we will not drop below $60. It is difficult to say when we will be heading back towards $75 which is the right on the monthly VWAP mark, but if you look at the value area (green on the chart), it will give you a good indication of where to start buying. At the moment the price of LTC is now undervalued, and sellers should jump in the train! For buyers, it is an excellent time to start buying with a price underneath the outlined value. Great times are ahead for LTC!
Time to enter the market!
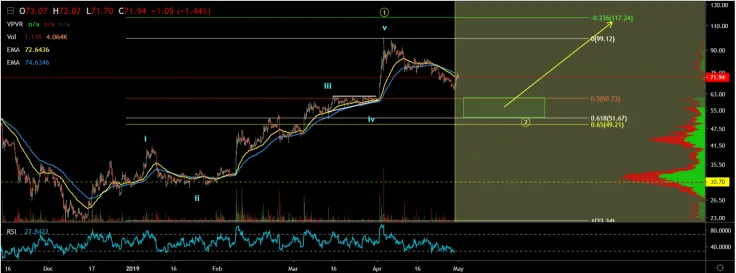
The weekly closed yesterday with a serious bearish candle pattern on a time frame that highly serves as a strong signal. That was Litecoin’s first real correction since the start of the run, on its way from $20 to $100.
The run ceased on the $100 mark, a highly psychological barrier for traders. We also had the 0.236 of retracement from the whole correction at $105. Overall the daily is looking quite bearish.
Now take a look at the chart: there’s an Elliott wave, and it looks like we ended a 5-wave impulsive structure. We're therefore looking for the highest probability zone for the end of the correction of a potential wave 2, which is around the 0.5 to 0.618 area. $62 looks like a great potential refill as we have confluence.
As we can see on Vpvr, the $60 to $100 range has always been neglected by traders, the volume is extremely low. That's basically why we are drilling through this price range. The next signs of liquidity will be around $62 as well.
On a 1H chart, LTC looks like a descending channel that we almost broke down. We can see some sort of consolidation on the RSI but the buy volume is still extremely weak. To conclude, if you're a bull, there is very little reason to buy right now: better wait for $62 to $57 offers for a decent ratio to refill.
Final thoughts
Optimistic traders thought that Litecoin is continuously going to keep going up. Well, this month has proven that what goes up must come down. Crypto trading requires a lot of patience and analysis, so wait for the right moment to enter the market – it will happen soon.
Price charts are taken from TradingView


 Arman Shirinyan
 Alex Dovbnya
 Denys Serhiichuk