
Disclaimer: The opinions expressed by our writers are their own and do not represent the views of U.Today. The financial and market information provided on U.Today is intended for informational purposes only. U.Today is not liable for any financial losses incurred while trading cryptocurrencies. Conduct your own research by contacting financial experts before making any investment decisions. We believe that all content is accurate as of the date of publication, but certain offers mentioned may no longer be available.
The world of cryptocurrency never ceases to fascinate with its intricate patterns and signals. Shiba Inu (SHIB) is once again at the center of attention of the cryptocurrency market due to its chart painting an intriguing candlestick pattern, known as the "reversed doji."
For those new to the realm of technical analysis, a doji is a candlestick pattern that typically has the same opening and closing price, signifying indecision on the market. A reversed doji, on the other hand, suggests that the ongoing trend might be on the verge of a reversal. If this pattern unfolds in line with historical behavior, it could point to another price rally for SHIB.
Now, while chart patterns offer a glimpse into potential price movements, it is essential to consider other corroborative data points to get a comprehensive picture. In the case of Shiba Inu, on-chain data strengthens the case for a bullish scenario.
Recent on-chain data indicated substantial SHIB transactions, suggesting that large investors, often called "whales," are showing interest. Such significant transactions can exert considerable upward pressure on the token's price.

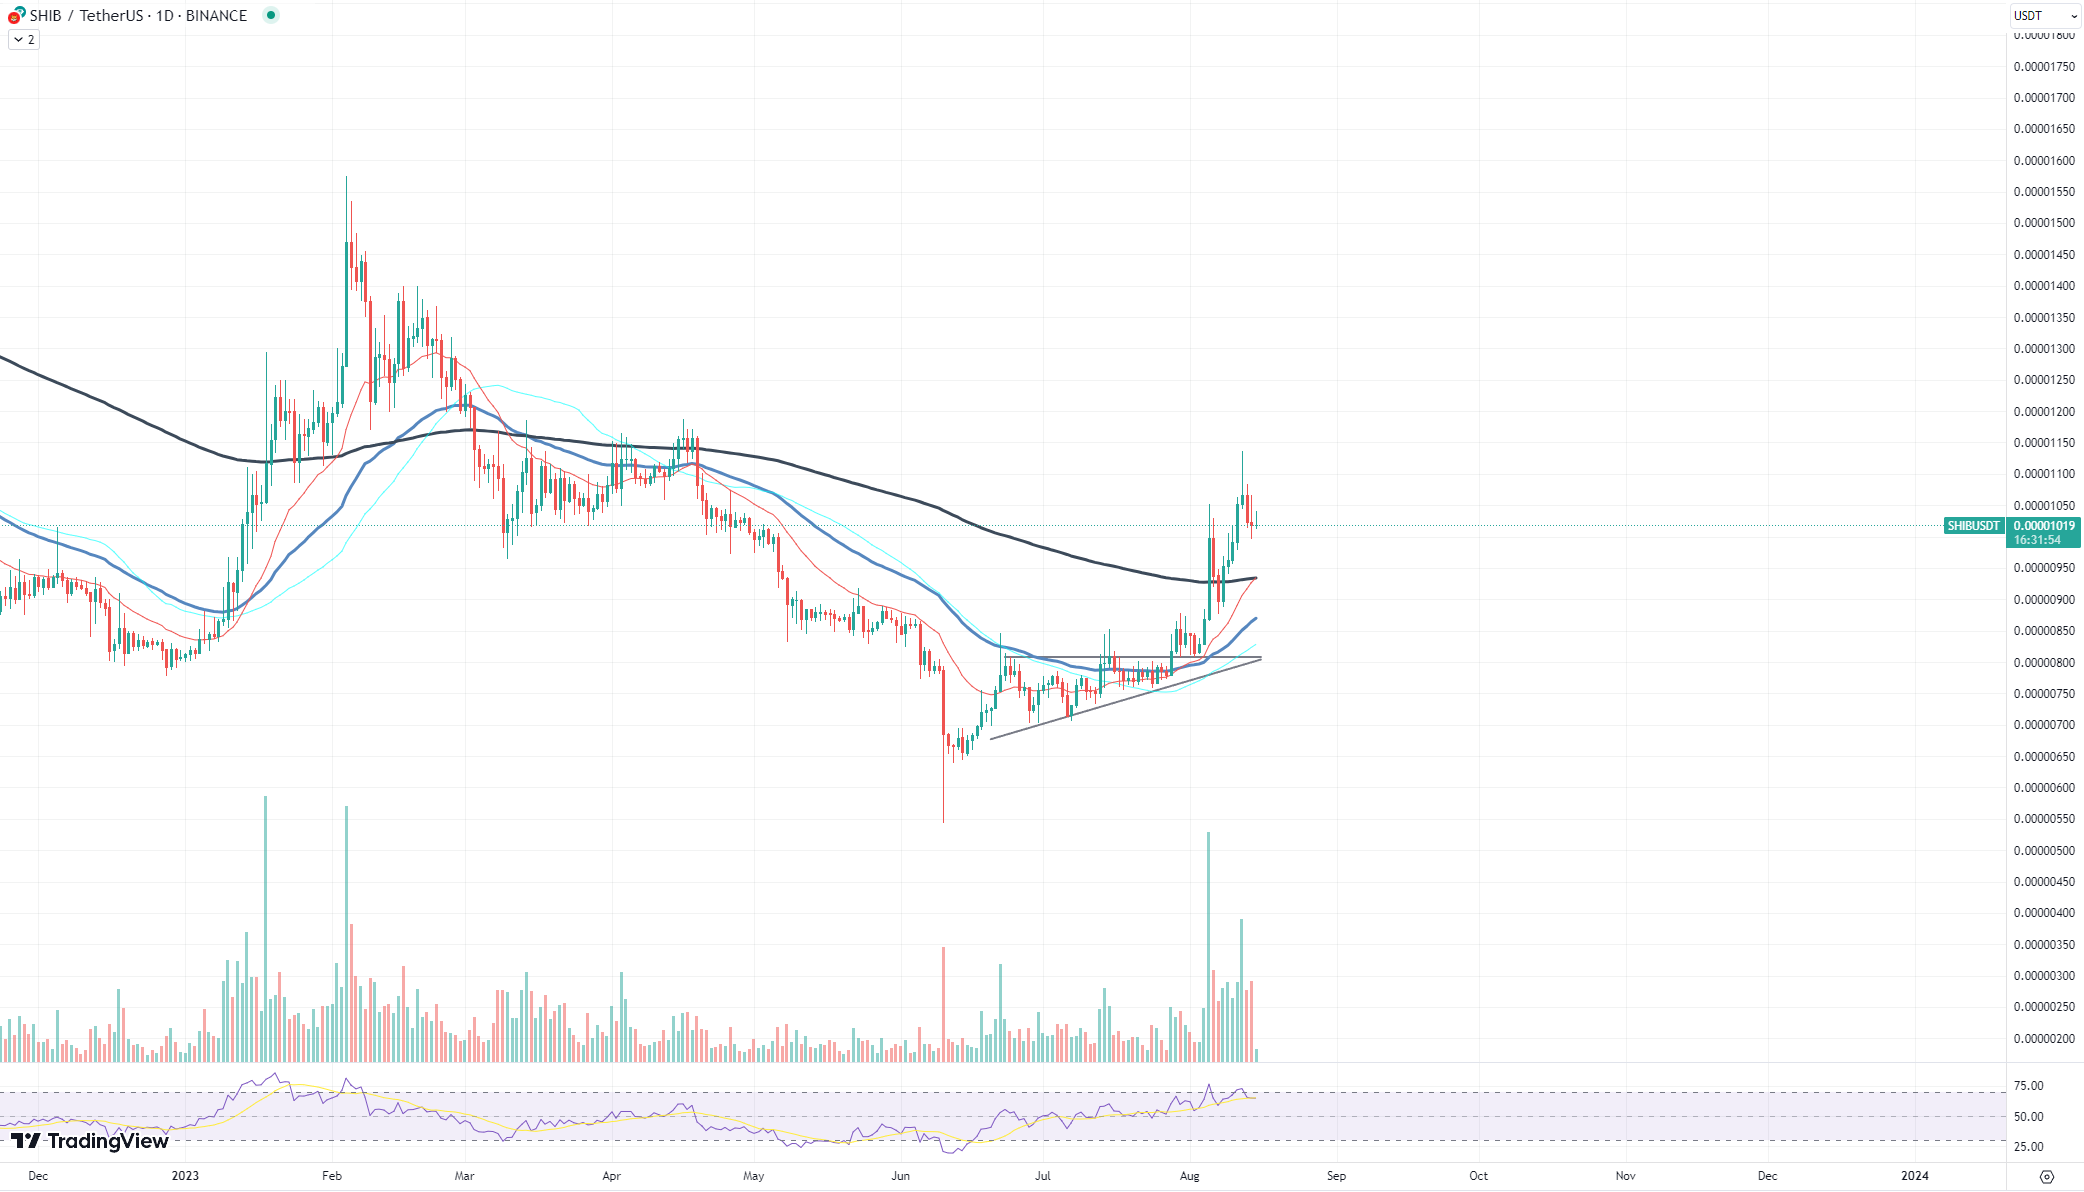
In addition to on-chain indicators, technical signals, previously shared, augment the bullish thesis. The emergence of Exponential Moving Average crossovers, for instance, aligns well with the narrative set by the reversed doji. The fact that a shorter-term EMA recently moved above its longer-term counterpart only reinforces the possibility of bullish momentum.
Predicting price movements of digital assets with absolute certainty is a tall order. However, the alignment of several bullish indicators for SHIB paints a promising picture. From the reversed doji candlestick pattern to large on-chain transactions and supportive technical signals, all roads seem to hint at a potential surge in Shiba Inu's price.
 Dan Burgin
 U.Today Editorial Team