
Disclaimer: The opinions expressed by our writers are their own and do not represent the views of U.Today. The financial and market information provided on U.Today is intended for informational purposes only. U.Today is not liable for any financial losses incurred while trading cryptocurrencies. Conduct your own research by contacting financial experts before making any investment decisions. We believe that all content is accurate as of the date of publication, but certain offers mentioned may no longer be available.
As the cryptocurrency market remains highly volatile, with price swings influenced by a multitude of factors, the meme coin Shiba Inu (SHIB) has successfully broken through a local resistance level, creating a setup for a longer-term reversal. A meticulous study of its recent chart showcases intriguing patterns that hint at a potential surge in its price trajectory.
First and foremost, a close examination of the SHIB/USDT chart reveals a coin that is in a fierce battle with the 21-day Exponential Moving Average (EMA). The 21-day EMA has historically acted as a decisive indicator of bullish or bearish momentum for many cryptocurrencies.
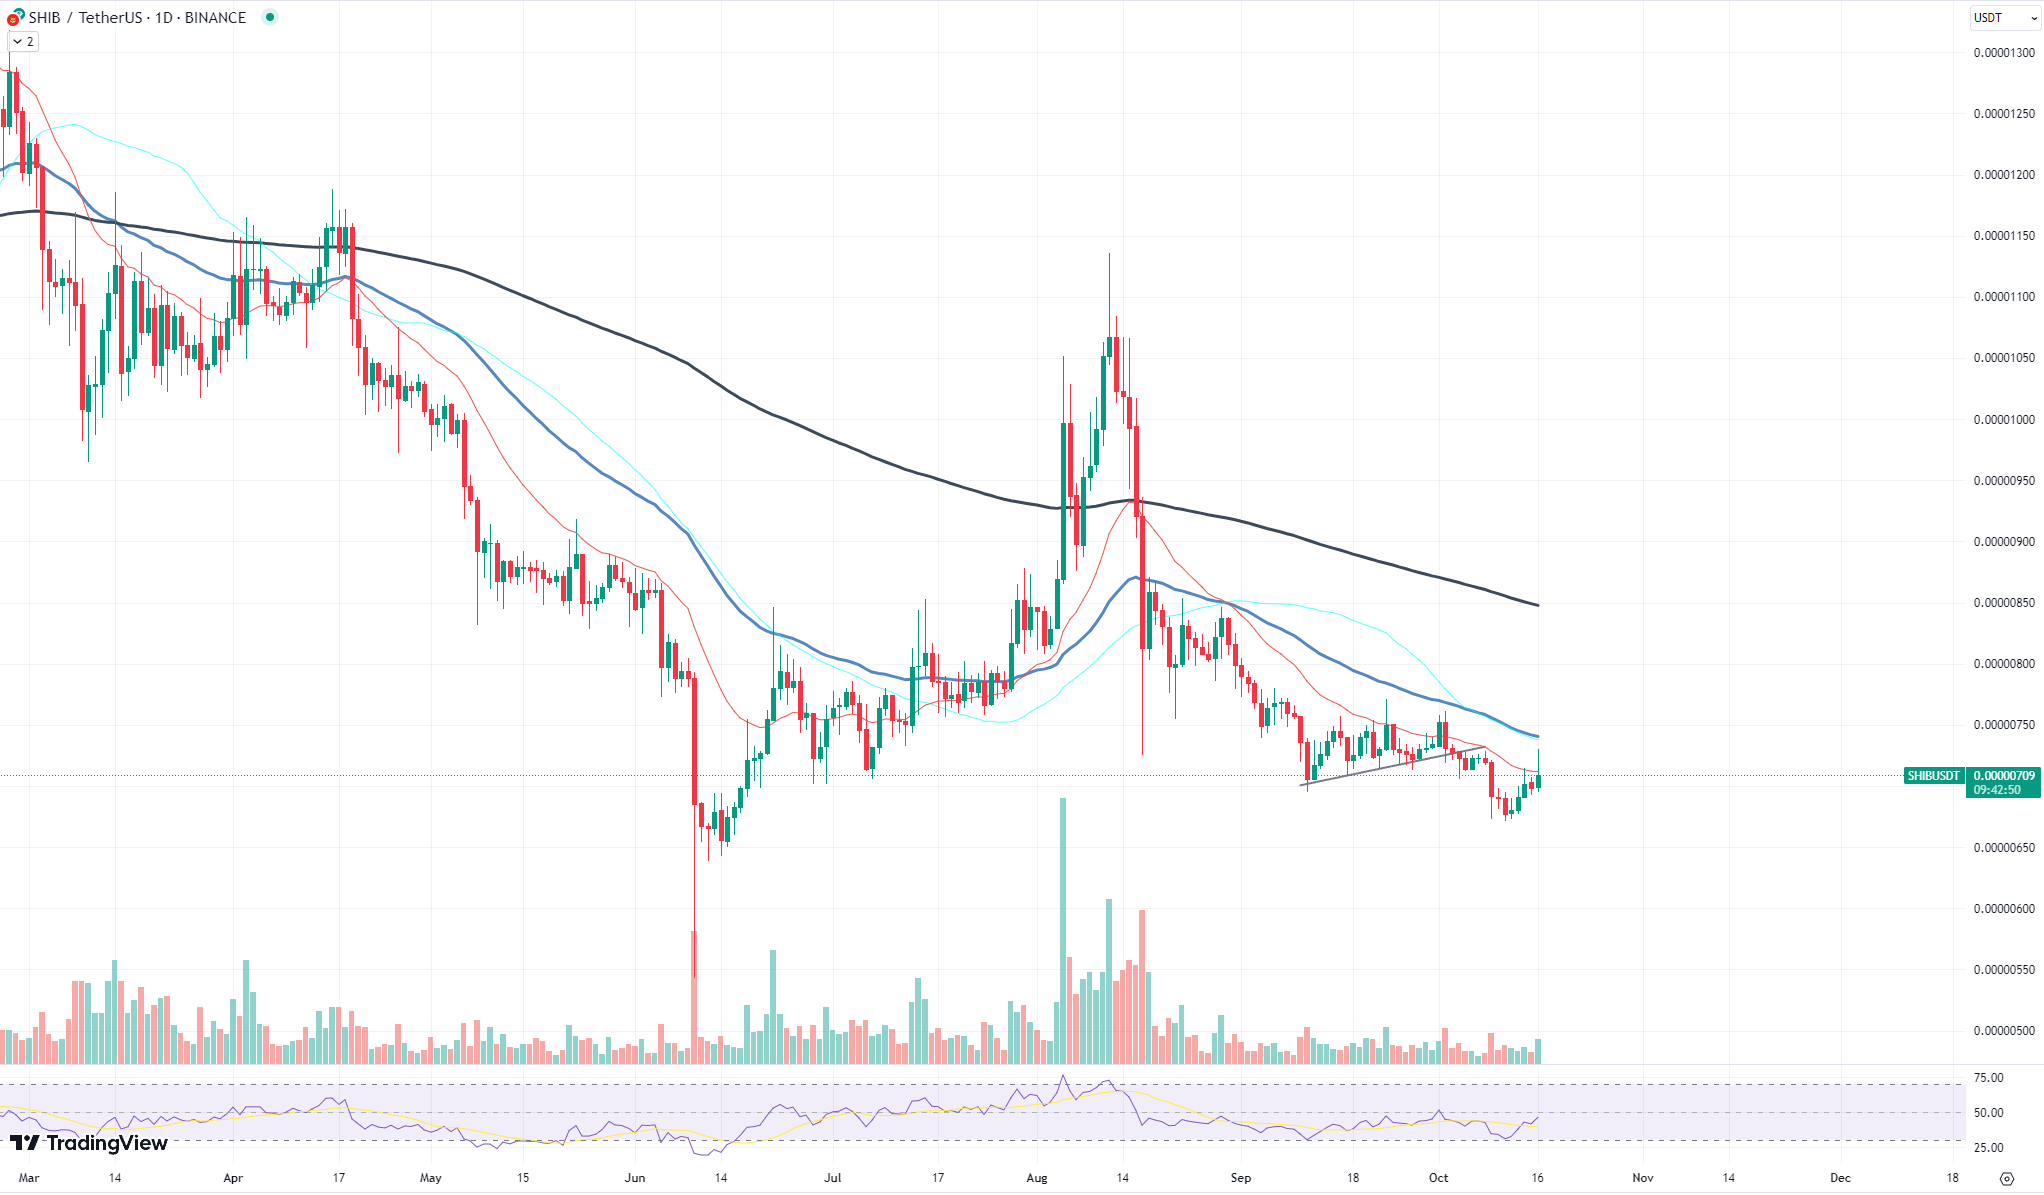
At present, SHIB seems to be testing this crucial resistance level, indicating a struggle between bears trying to push the price down and bulls aiming to propel it higher. If SHIB manages to close above this level, traders could expect newfound bullish momentum.
However, while there is visible optimism on the chart, it is crucial not to overlook some underlying factors. One of the most conspicuous elements is the descending trading volume. A price chart depicting a cryptocurrency battling key resistance, like the 21-day EMA, ideally should be accompanied by rising trading volumes.
This would indicate a strong buying interest and add validity to the price movement. In SHIB's case, the decreasing volume presents a contrary narrative. It raises concerns over the sustainability of any bullish run, as a surge without substantial volume support might be short-lived.
Ethereum makes comeback
The Ethereum (ETH) price chart reveals a complex tale of struggles and ambitions. As the second-largest cryptocurrency by market cap, Ethereum's price trajectory is a major point of interest for traders and investors alike. A careful observation of the recent chart suggests that Ethereum is once again brushing up against the $1,600 threshold. But can it sustainably surpass this level?
Ethereum appears to be navigating challenging waters. For the past few weeks, a discernible downtrend has been evident. The price movements have been confined beneath the descending resistance line, characterized by lower highs and lower lows. This paints a somewhat bearish picture, indicating consistent selling pressure at higher levels.
However, not all hope is lost for the Ethereum enthusiasts. The coin is currently hovering around the $1,600 mark, which has historically acted as a significant support and resistance zone. If Ethereum can close above this level and maintain its stance, it could be an early indicator of a trend reversal. A sustained move above this threshold could catalyze further buying interest, potentially propelling ETH to higher levels.
Can Solana repeat September's growth?
Solana's (SOL) trajectory in the crypto market has been nothing short of remarkable, with its meteoric rise catching the eyes of traders and investors worldwide. While the recent charts point to a potential rebound, the natural question arises: can Solana repeat September's growth?
Upon examining the provided SOL/USDT chart, one can observe a budding uptrend. The price appears to be finding support along an ascending trendline, suggesting growing confidence among buyers. Notably, this current uptrend bears resemblance to the early stages of Solana's surge in June. Back then, Solana's price steadily built momentum before skyrocketing in September, reaching unprecedented highs and solidifying its position as one of the top crypto assets.

However, while the current chart displays optimistic signs, it is crucial to note the differences between the two periods. The explosive growth in September was a combination of fundamental and technical factors. The launch of various decentralized applications (dApps) on Solana, along with growing adoption, were significant catalysts. It was a perfect storm of demand, technology and market sentiment propelling Solana into the spotlight.
In contrast, the current scenario is marked by industry-wide hesitation, with many cryptocurrencies grappling to regain their former glory after substantial pullbacks. Although Solana's recent movements hint at a potential bullish phase, the magnitude and pace of its ascent might not mirror that of September.
 Dan Burgin
 U.Today Editorial Team