Disclaimer: The opinions expressed by our writers are their own and do not represent the views of U.Today. The financial and market information provided on U.Today is intended for informational purposes only. U.Today is not liable for any financial losses incurred while trading cryptocurrencies. Conduct your own research by contacting financial experts before making any investment decisions. We believe that all content is accurate as of the date of publication, but certain offers mentioned may no longer be available.
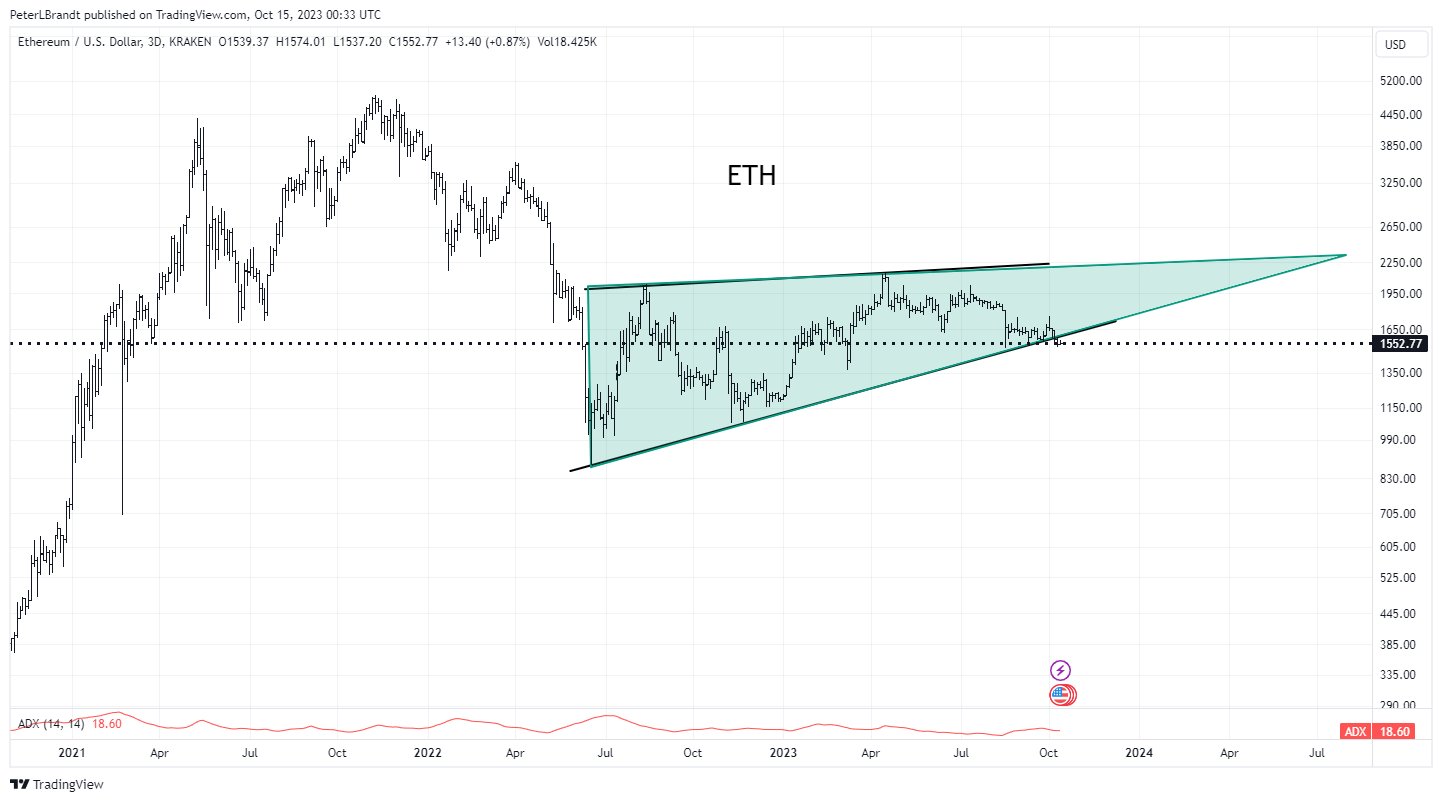
Veteran trader Peter Brandt put his X followers to the test on classical charting principles. Brandt posted an ETH chart that highlighted a pattern. He proceeded to ask his followers if the highlighted pattern was a rising wedge and, if not, what would need to happen to make it a wedge.
For context's sake, a rising wedge is a chart pattern used in technical analysis to predict a likely bearish reversal. It is depicted by a narrowing price range with higher highs and higher lows, both of which are enclosed by upward-sloping trendlines.
The question posed by the veteran trader does not seem not far-fetched, given that other chart patterns resemble the rising wedge pattern, both in structure and in trading strategies.

The falling wedge, ascending and descending triangles, symmetrical triangles, flags and pennants are examples.
An X user responded to Brandt's question by stating that the price action would need to touch the upper trendline a third time for the pattern to meet the definition of a wedge.
Brandt agreed that a third upper contact point would be required for the wedge to properly form while adding that, more than likely, the pattern presented on the ETH chart might morph into something else.
Ethereum price action
Ethereum experienced declines in the past week, reaching a seven-month low at $1,520. The downward price movement coincided with Ethereum's total transaction fees declining to their lowest levels in years.
According to on-chain analytics firm IntoTheBlock, total Ethereum fees hit their lowest point since April 2020. This decrease could be attributed to the migration to Layer 2 and the decreasing usage of applications on the mainnet.

In another tweet, IntoTheBlock noted that Ethereum's supply has been rising for the first time since December 2022, with the low transaction fees and increasing daily issuance contributing to this inflationary trend.
At the time of writing, ETH had slightly rebounded and was up 1.89% in the last 24 hours to $1,585.
 Dan Burgin
 U.Today Editorial Team