Disclaimer: The opinions expressed by our writers are their own and do not represent the views of U.Today. The financial and market information provided on U.Today is intended for informational purposes only. U.Today is not liable for any financial losses incurred while trading cryptocurrencies. Conduct your own research by contacting financial experts before making any investment decisions. We believe that all content is accurate as of the date of publication, but certain offers mentioned may no longer be available.
Shiba Inu (SHIB) is showing signs of life amid a market that has been relatively quiet in terms of liquidity and volatility. Over the weekend, the meme coin displayed a green candle, sparking optimism among traders and investors. This uptick is particularly noteworthy because it comes at a time when the broader market is relatively stagnant.
What is fueling this optimism? Well, Shiba Inu has hit multiple support levels recently, creating a strong foundation for potential upward movement. The absence of significant resistance levels ahead adds to the bullish sentiment. In layman's terms, the path of least resistance for SHIB appears to be upward, at least for now.
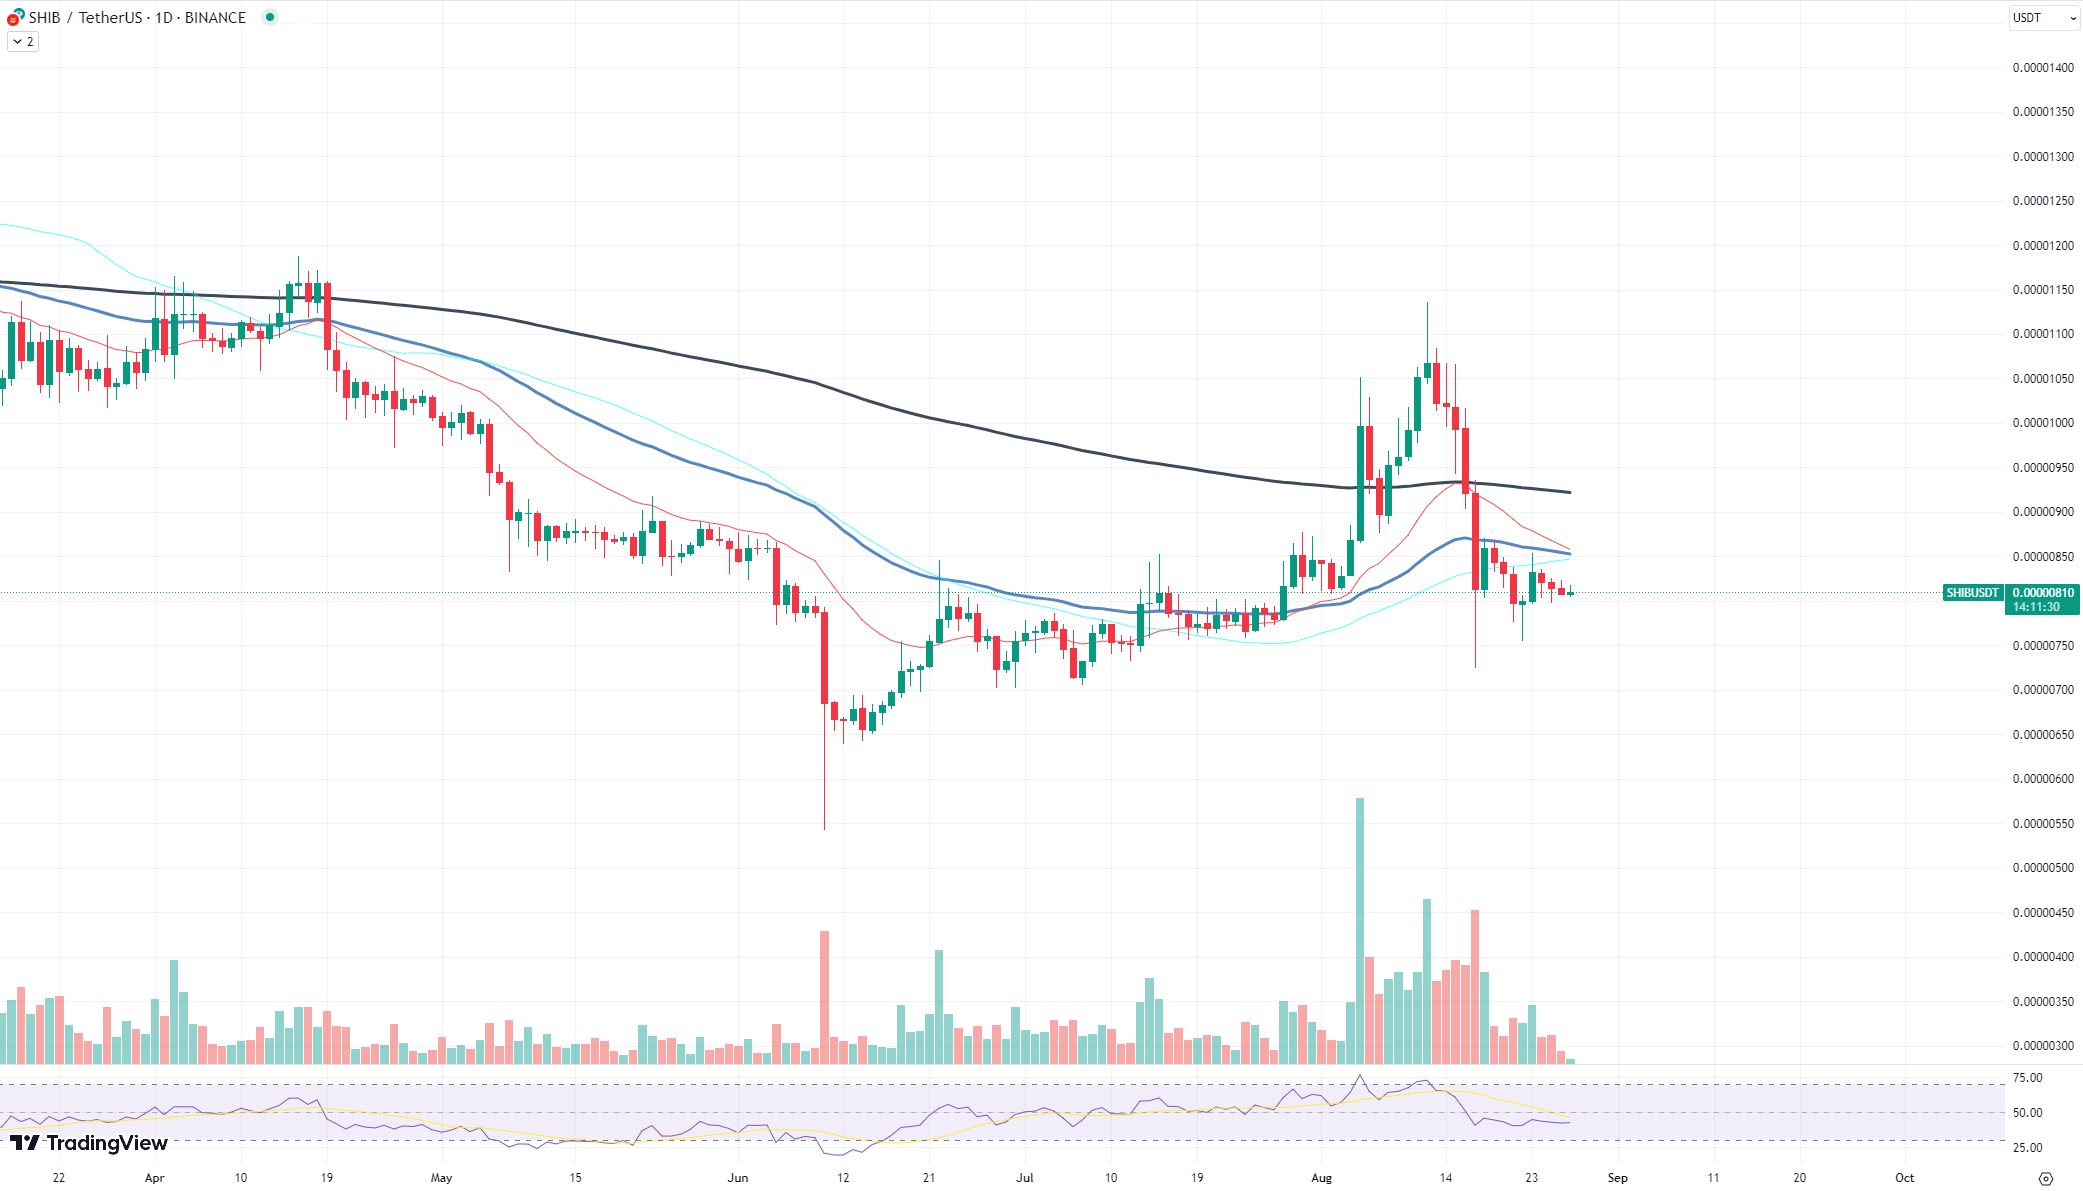
The upcoming trading week could be a defining moment for Shiba Inu. With a green candle already in play and several support levels reinforcing its position, SHIB has a favorable setup for a bullish reversal. Traders are eyeing this meme coin closely, as its recent behavior suggests it could be gearing up for a more substantial move.
Cardano is stuck
For the past 10 days, Cardano (ADA) has been stuck in a sideways trend, leaving investors and traders wondering when the next big move will happen. The relative strength index (RSI) is showing some divergence, hinting at a possible change in the asset's trajectory. With trading volume expected to surge Monday, we might be on the cusp of a trend reversal that could break Cardano out of its current stagnation.
Based on the recent price data, Cardano's price has been fluctuating between approximately $0.26 and $0.29 over the last 14 days. The RSI divergence suggests that the asset is potentially oversold, making it ripe for a bullish reversal. The sideways movement, coupled with this divergence, indicates that traders are becoming increasingly interested in ADA, setting the stage for a potential breakout.
The anticipated surge in trading volume Monday could be the catalyst that Cardano needs. Increased trading activity often leads to significant price movements, and given Cardano's current setup, the odds seem to favor a bullish outcome. If the trading volume does indeed spike, it could provide the necessary momentum for ADA to break free from its sideways trend and possibly initiate a new upward trajectory.
Be not afraid of Ethereum's cross
The crypto community is buzzing with talks of an impending "Death Cross" for Ethereum (ETH). While this technical pattern often sends shivers down the spines of traders, it is essential to take a step back and assess its real impact, especially when it comes to Ethereum.
First, let's talk about what a Death Cross is. It occurs when a short-term moving average crosses below a long-term moving average, typically signaling a bearish trend. However, it is crucial to note that Ethereum has seen both Death Cross and Golden Cross patterns multiple times in the past, and they have not proven to be particularly effective indicators for this asset in recent months.
Based on the price data from June to August 2023, Ethereum's price has been fluctuating significantly, ranging from as low as $1,647 to as high as $1,945. While the asset has seen some volatility, it has not followed a consistent trend that could be reliably predicted by a Death Cross or Golden Cross.
So, what does this mean for traders and investors? Essentially, while the Death Cross might be a red flag in some contexts, Ethereum's historical data suggests that it is not a surefire indicator of a prolonged bearish phase.
The pattern has not been a reliable predictor for Ethereum, and given the asset's inherent volatility and the broader market influences, it is unlikely to offer the kind of value that traders might expect.
 Dan Burgin
 U.Today Editorial Team