Disclaimer: The opinions expressed by our writers are their own and do not represent the views of U.Today. The financial and market information provided on U.Today is intended for informational purposes only. U.Today is not liable for any financial losses incurred while trading cryptocurrencies. Conduct your own research by contacting financial experts before making any investment decisions. We believe that all content is accurate as of the date of publication, but certain offers mentioned may no longer be available.
The cryptocurrency market is rife with technical indicators, and one that often captures attention is the Golden Cross. For XRP, this indicator is showing mixed signals depending on the time frame you are looking at.
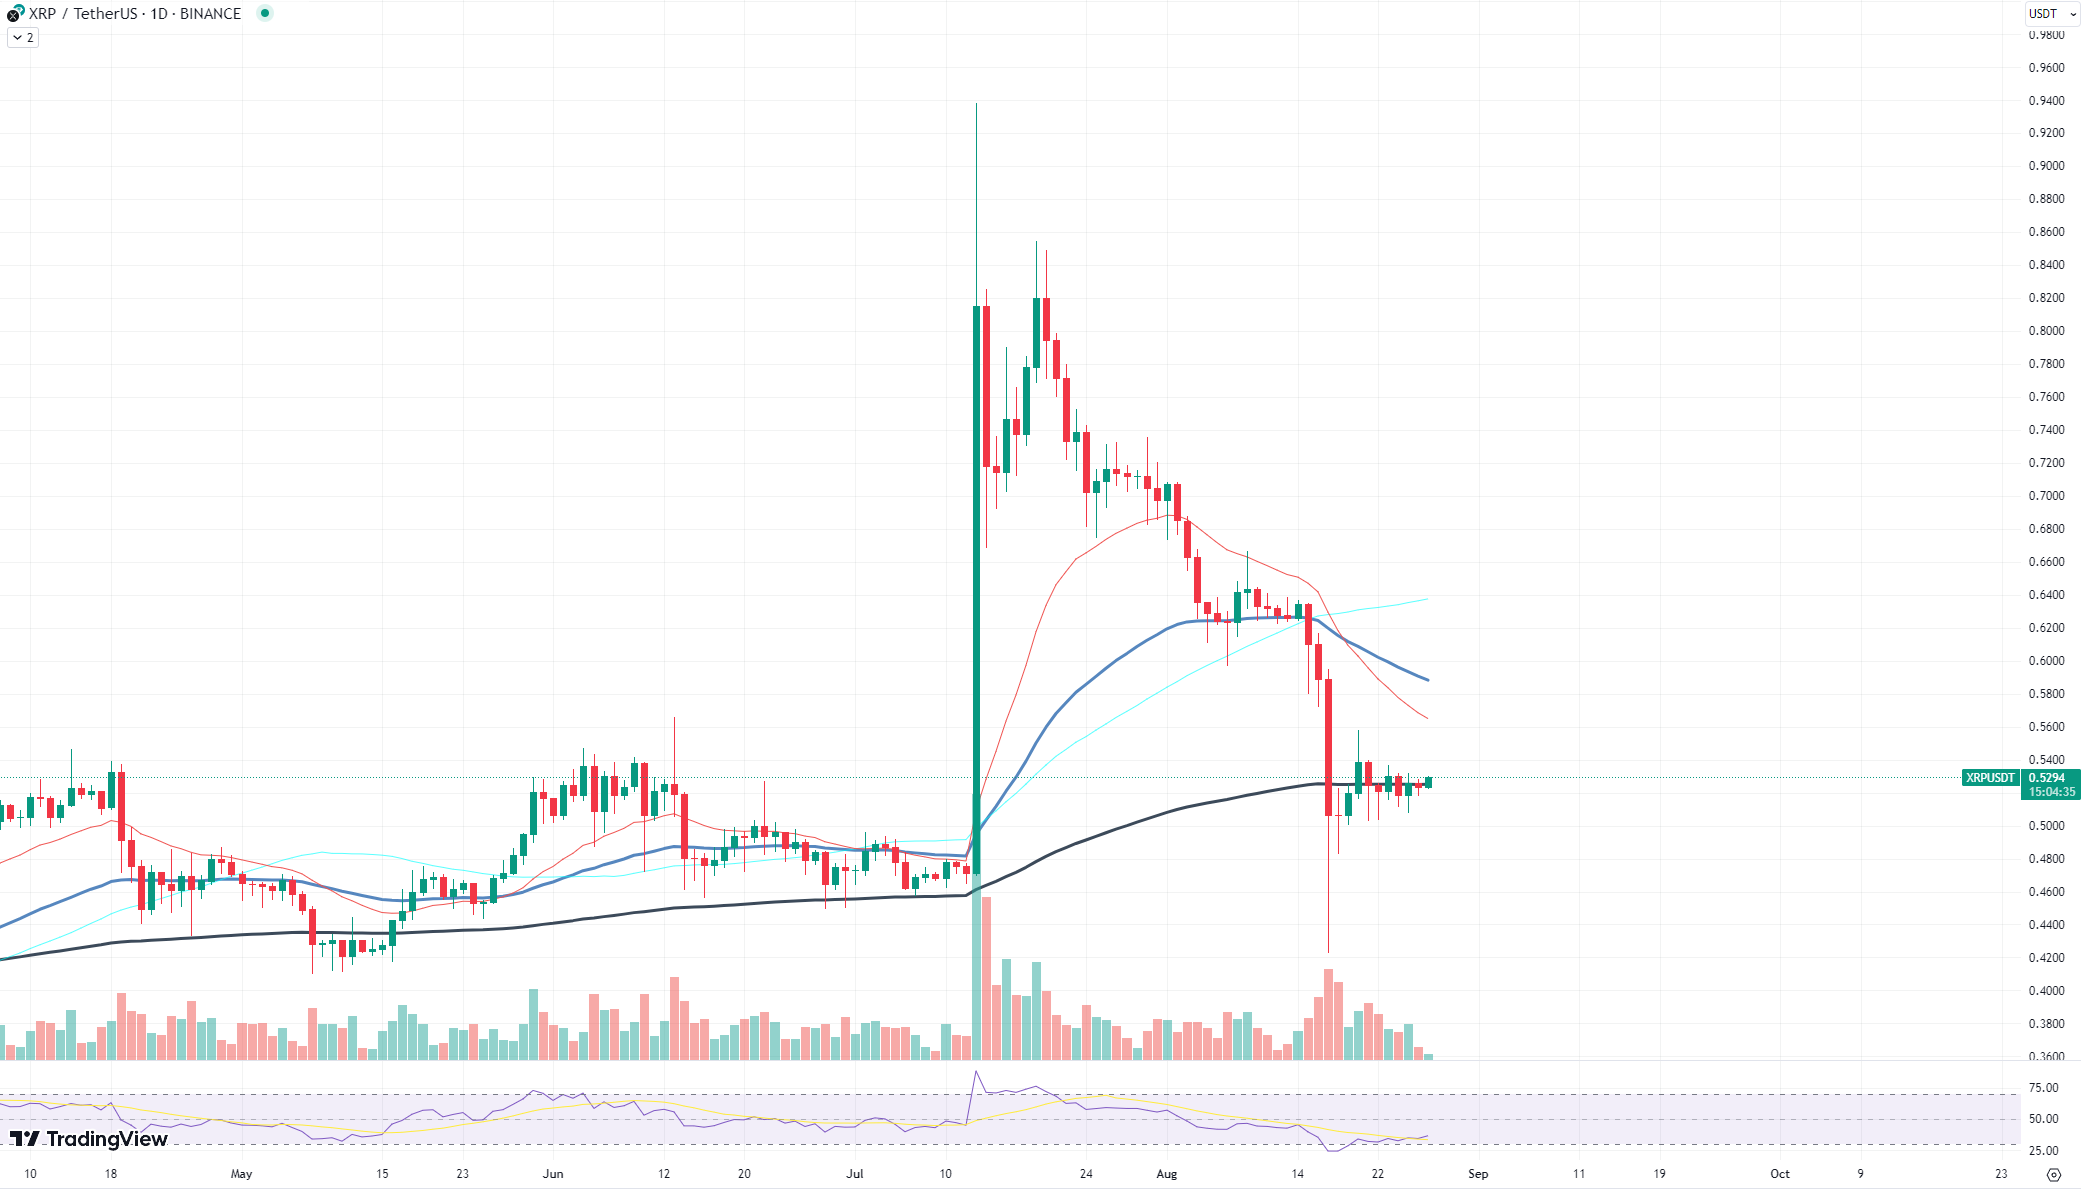
On the weekly chart, the Golden Cross remains intact, suggesting potential bullish momentum. However, on the daily chart, this indicator was invalidated quite some time ago, raising questions about its reliability for predicting price movements.
As of the most recent data, XRP is trading at $0.52759. On the weekly chart, it has recently hit the 50 EMA (exponential moving average) price level. This could be a crucial point for the cryptocurrency, as a bounce off this level could signal a bullish trend in the coming days.
However, it is essential to note that the Golden Cross, while often considered a bullish indicator, has shown its limitations. It is not always the most reliable predictor of price swings, especially in the volatile crypto market.
The insignificance of the Golden Cross as a standalone indicator becomes evident when we consider its performance on different time frames. While the weekly chart shows a Golden Cross, the daily chart had invalidated this indicator a long time ago. This discrepancy suggests that traders and investors should not solely rely on this technical signal for their market analysis.

Moreover, the current price of XRP is consolidating around the 50 EMA on the weekly chart. This could be a make-or-break level for the cryptocurrency. If it manages to bounce off this level, we could see a bullish trend emerge. However, if it breaks below, it could signal a bearish trend, making the Golden Cross on the weekly chart less significant.
While the Golden Cross on XRP's weekly chart may seem promising, it is crucial to approach this indicator with caution. It has proven to be an unreliable predictor of price movements when considered in isolation.
 Dan Burgin
 U.Today Editorial Team