Disclaimer: The opinions expressed by our writers are their own and do not represent the views of U.Today. The financial and market information provided on U.Today is intended for informational purposes only. U.Today is not liable for any financial losses incurred while trading cryptocurrencies. Conduct your own research by contacting financial experts before making any investment decisions. We believe that all content is accurate as of the date of publication, but certain offers mentioned may no longer be available.
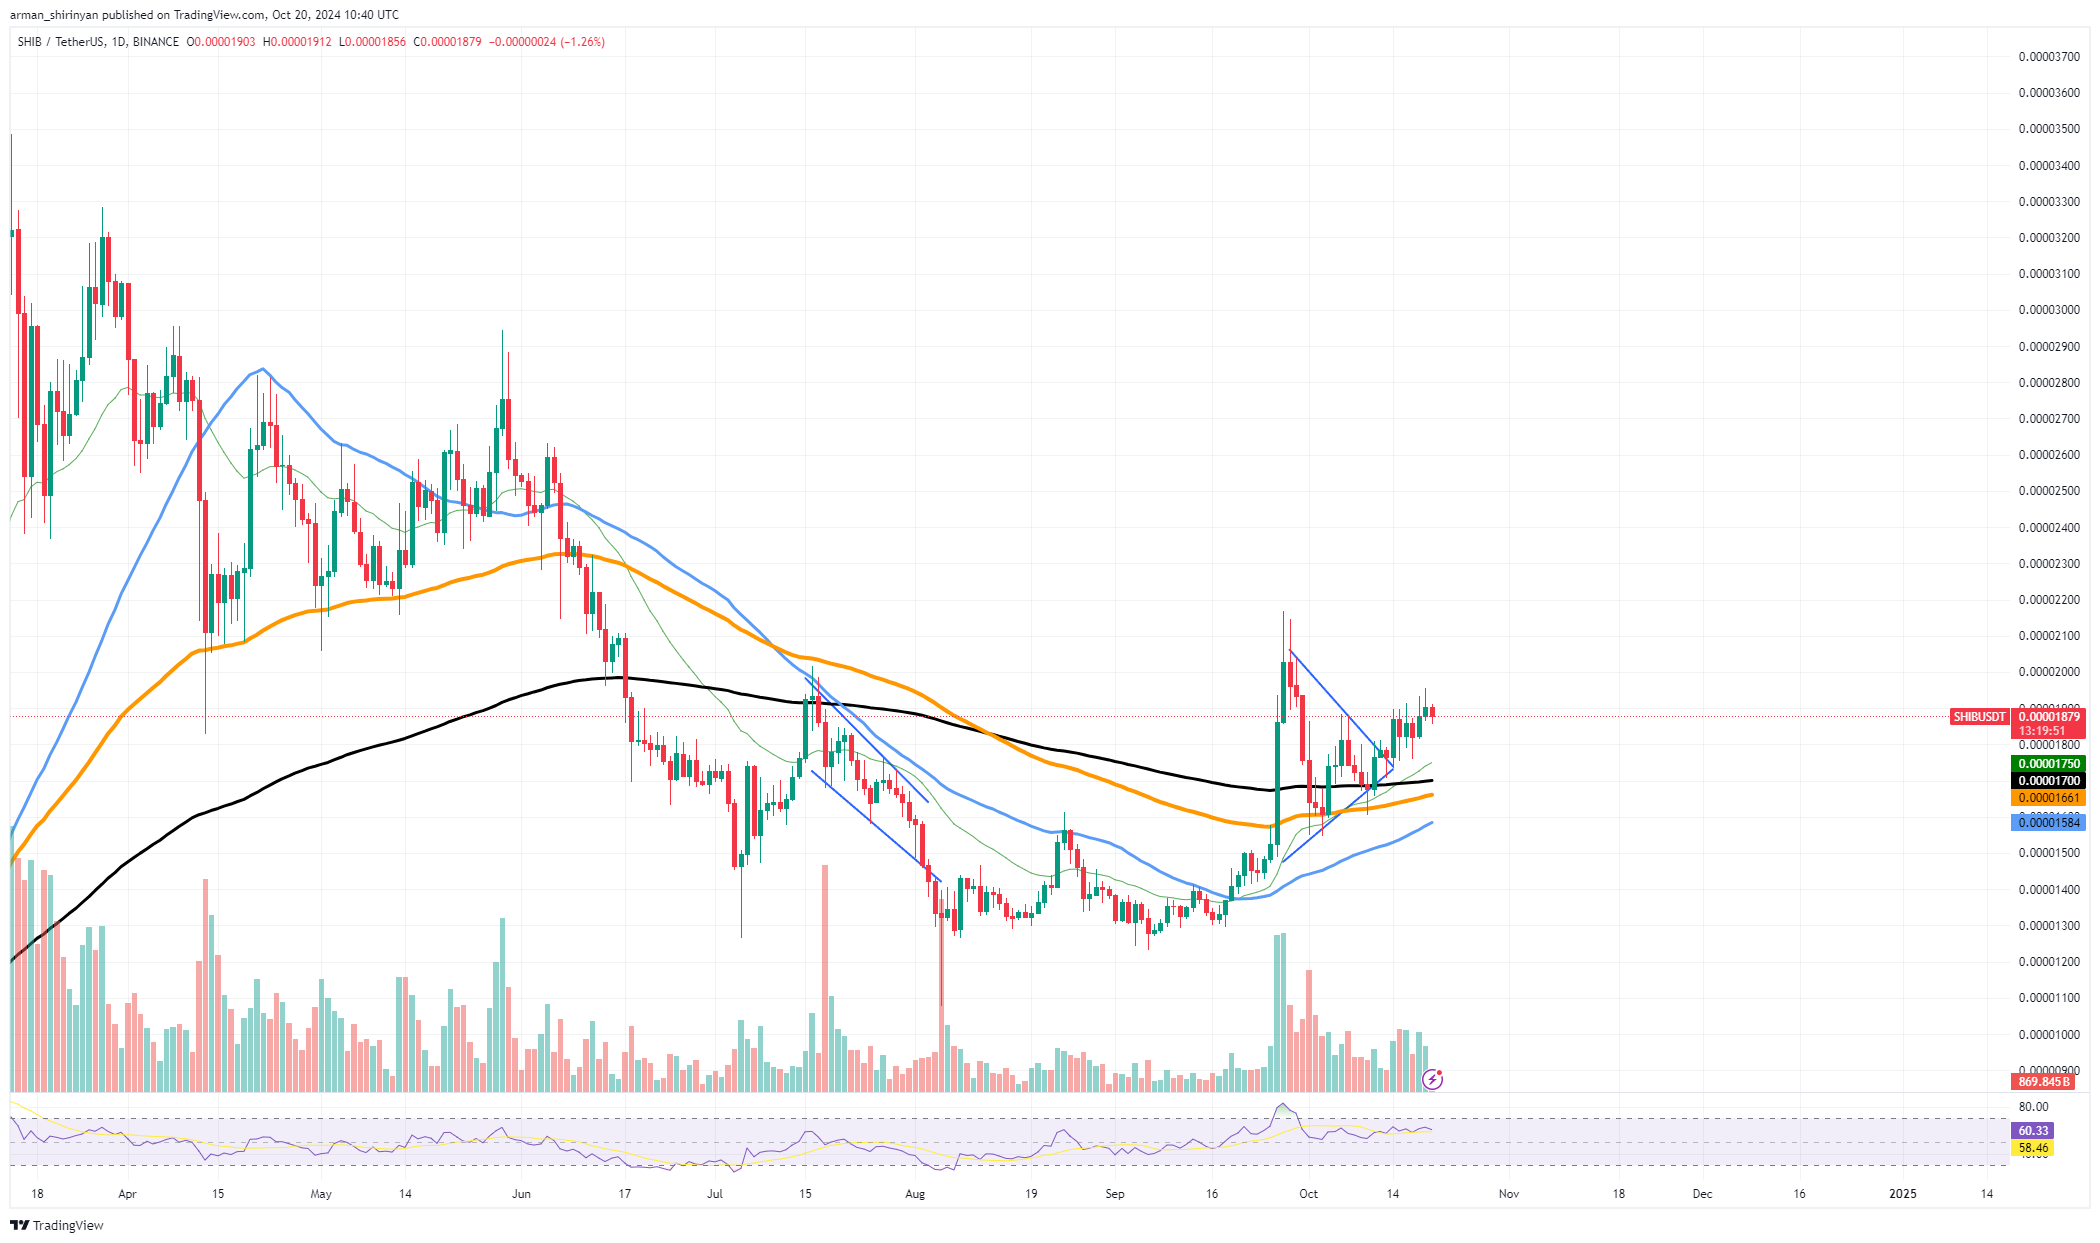
With a 20% rise in profitability, Shiba Inu is emerging as a possible recovery, which may portend a bullish run for the asset. The data indicates that 55% of SHIB holders are now profitable, which is an increase from earlier levels. This increase in profitability may draw in more investors who believe SHIB has fresh growth potential.
The fact that 73% of SHIB is held by large holders further suggests that whales are still holding a sizable amount of the asset. The bullish case for Shiba Inu's could be strengthened if the upward trend persists even though whale activity has been a little bearish lately. The 20% increase in profitability is significant because it signals a change in market sentiment that tends to be more positive for SHIB.

The potential for a long-term recovery is high as 79% of holders have owned SHIB for more than a year. Stability is offered by this devoted holder base, and if the upward trend continues, it might inspire these holders to buy more, raising the price of SHIB. From a technical perspective, SHIB is trading above the 50-, 100- and 200-day EMAs, indicating a strengthening trend.
A more substantial price rally might be triggered by a breakout of the symmetrical triangle pattern that is developing on the chart. Additionally, a golden cross, a long-term bullish signal, may form and confirm an extended upward trend. However, as indicated by the bearish on-chain signals, the overall sentiment remains mostly bearish due to a decline in large transactions and minimal network growth.
Ethereum's path
As it forms a troubling chart pattern, Ethereum is at a pivotal point in its history. Head and Shoulders patterns are usually bearish formations that may signal an impending reversal in an upward trend, and that is what looks to be developing on the daily chart.
As Ethereum fails to overcome significant resistance levels, this pattern becomes even more concerning and raises questions about the asset's short-term viability. Let us examine both bullish and bearish scenarios when examining possible price targets for Ethereum. If Ethereum is able to break above the 100 EMA, which is currently at $2,650, this price target would be the first meaningful milestone.
A breakout of this kind might indicate that ETH is gaining momentum again, paving the way for a test of the next psychological level at $2,900. Given that it corresponds with the subsequent resistance level from early August, this price range is significant. If Ethereum gains sufficient traction and breaks above $2,900, $3,100 is the next possible target.
This level is significant because it falls on the long-term 200 EMA, which is displayed on the chart as the black line.
On the downside, Ethereum's price may drop back to about $2,400 if it is unable to maintain above its present support levels. This target is bearish because it is the lower bound of the rising channel that Ethereum has been trading in over the last several months, which makes it significant. If the price drops below this mark, it might be an indication of more weakness and possibly a deeper correction.
Solana is in trouble
Reaching the $160 price level, a significant resistance zone that may dictate the asset's next big move, Solana is about to face a critical test. Technical indicators point to a possible reversal if buyers don't step up their efforts as SOL has historically had trouble keeping momentum going past this point.
The profile gives a mixed picture when examining the exponential moving averages. A cautious outlook in the market is indicated by the 50 EMA's placement below the 100 EMA. Not only is Solana not fully in a bearish phase, but it is also not clearly in an uptrend as evidenced by the fact that the 50 EMA is still above the 200 EMA. With the market waiting for a stronger push in either direction, this setup suggests indecision. Keeping an eye on the $160 resistance level is crucial.
A potential price reversal may occur soon if SOL is unable to break and maintain above this level. Another worrying indication of declining buying interest is the volume that has been declining over the last few days. In the event of a rejection at this point, SOL might retreat back to support levels at $147 or even lower, depending on the state of the overall market.
Conversely, a strong break above $160 might pave the way for additional gains, particularly if buying volume rises. SOL may retest stronger resistance zones in this scenario, aiming for the $180-$200 region.


 Tomiwabold Olajide
 Caroline Amosun
 Dan Burgin
 Godfrey Benjamin