
Disclaimer: The opinions expressed by our writers are their own and do not represent the views of U.Today. The financial and market information provided on U.Today is intended for informational purposes only. U.Today is not liable for any financial losses incurred while trading cryptocurrencies. Conduct your own research by contacting financial experts before making any investment decisions. We believe that all content is accurate as of the date of publication, but certain offers mentioned may no longer be available.
In a single day, Shiba Inu recorded an incredible on-chain transfer volume of over 10 trillion tokens, showing that network activity has picked up speed following weeks of inactivity. Alongside this increase in transfer volume, Etherscan data indicates that the number of transactions remained stable at about 5,400, indicating that whale-sized movements rather than retail flows were the main driver.
Shiba Inu stays enclosed
SHIB is currently trading close to the $0.00001300 level as it attempts to level off following its recent erratic performance. As it presses against several technical resistances that have limited upside momentum, the asset is trapped inside a convergent triangle structure.
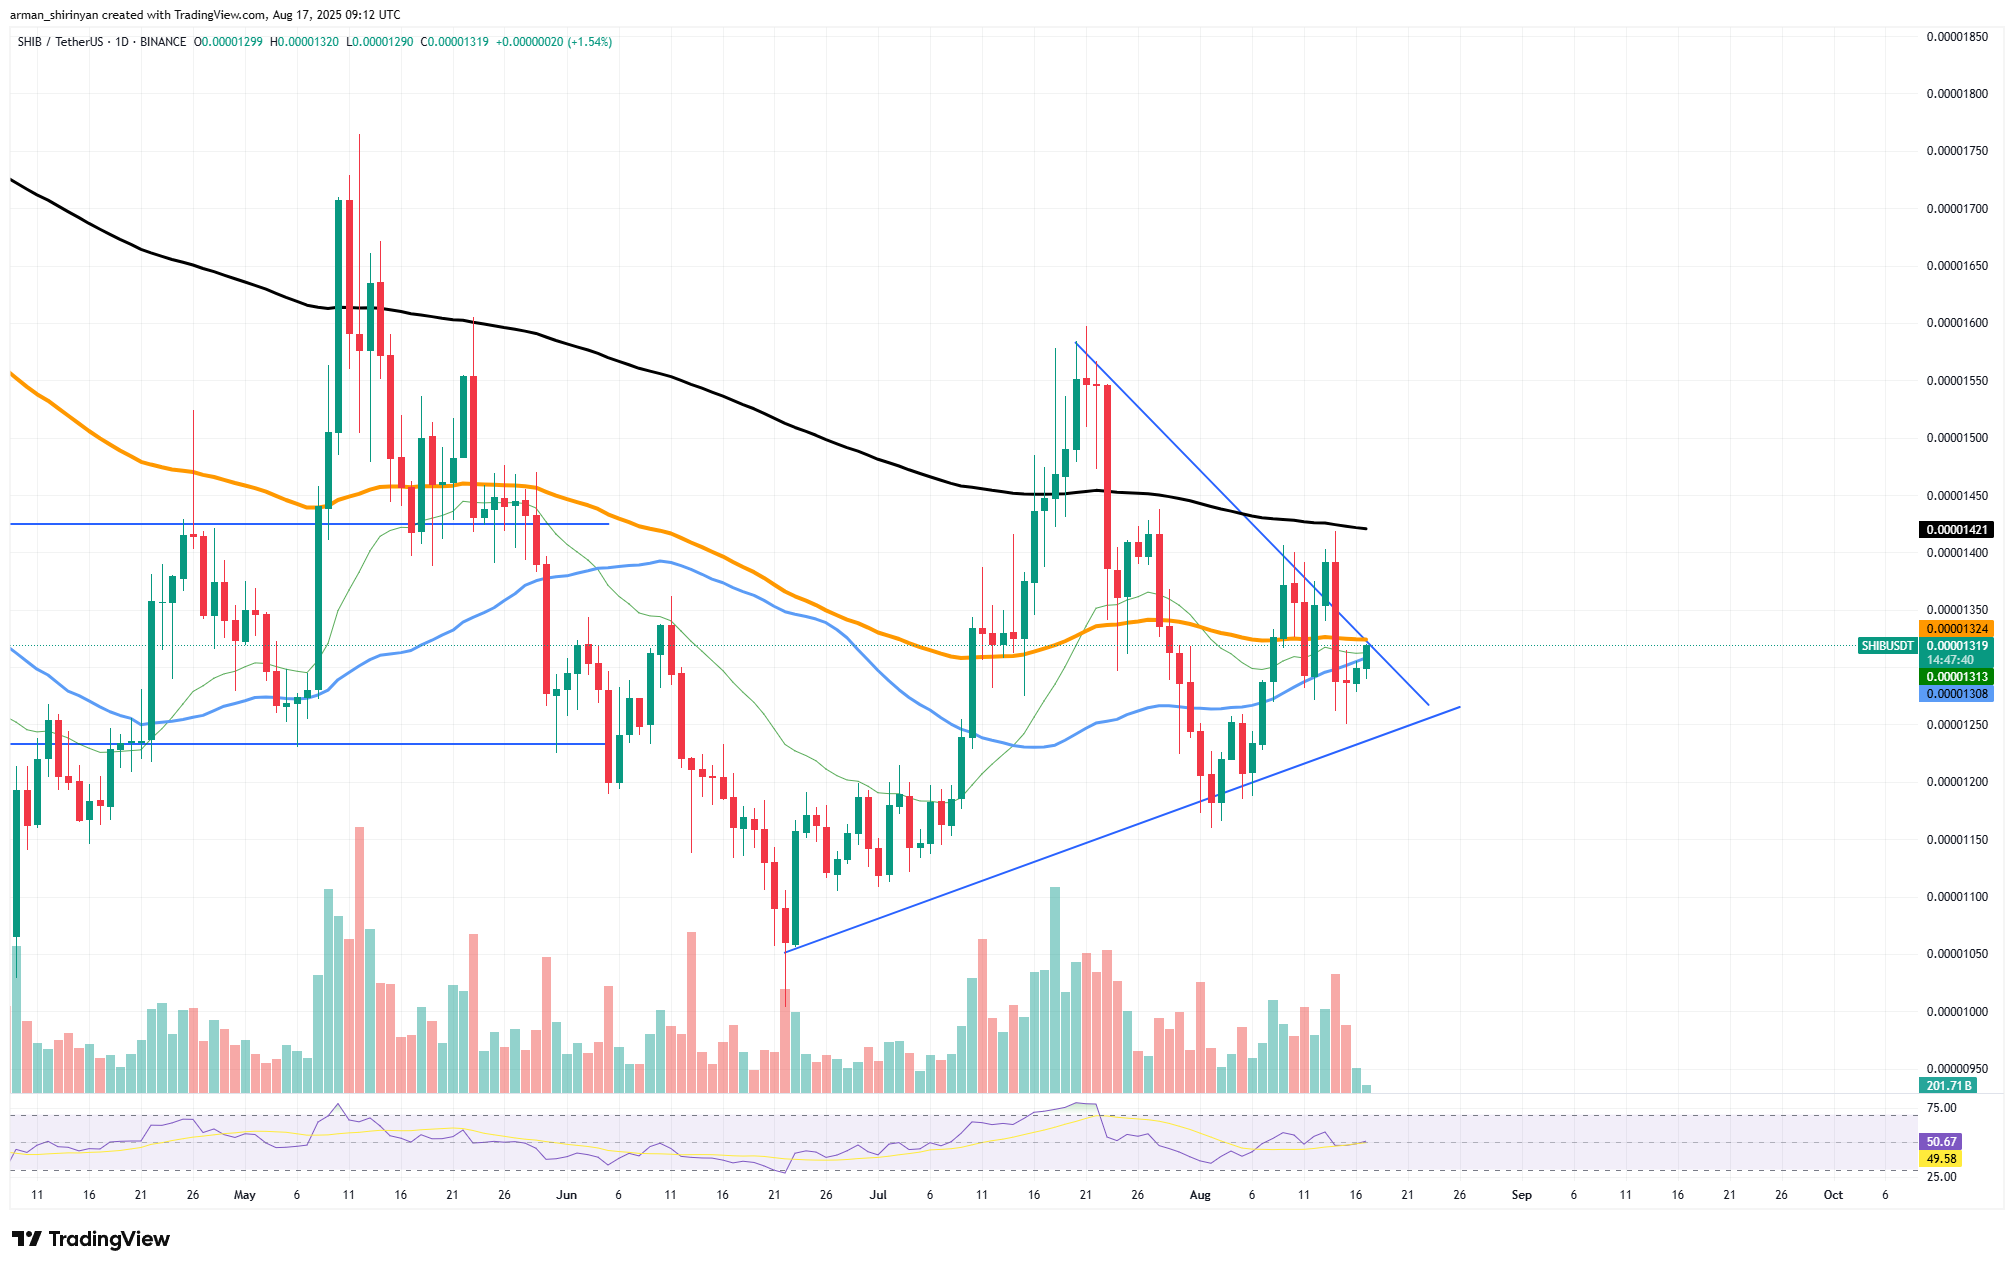
The 26 EMA, which SHIB has had difficulty holding above in recent weeks, is the first source of resistance. The 50 EMA, which is located just above the market, serves as a recurrent rejection zone. The technical pressure is further increased above that by the addition of a ceiling by the 100 EMA. The descending trendline, a structural resistance that has continuously pushed the price lower, is the fourth barrier.

Last but not least, the 200 EMA, which is aligned close to $0.00001420 and has consistently obstructed bullish advances since spring, is the most problematic barrier. The daily chart's steadily rising volume is not totally bullish; high volume without robust price follow-through may suggest distribution rather than accumulation.
The fact that the RSI is still neutral indicates that SHIB has flexibility to move either way. Near $0.00001350 and $0.00001420, the latter of which is the 200 EMA test, are the next upside targets if bulls are able to break through the layered resistance cluster.
 Dan Burgin