Volatility is an important parameter to consider whilst preparing to conduct trades, especially with lesser known currencies that these days are bought and sold every hour as a promising pathway to quick profits. It shows how unstable any given cryptocurrency’s market price is and how much periodic price figures deviate from the average, which can be seen by percent.
If you take any column of price values, calculate their average (i.e. mean), then look at how much each value is different from that average (i.e. get the deviations), square all those deviations and, in turn, calculate their own mean, you will get statistical variance. Calculate the square root of that variance, and you will get what is known as standard deviation. Turn that standard deviation into percentage representations, and here is your volatility.
Having processed prices of the selected altcoins taken at five minute intervals for the past three months and calculated their respective variance and standard deviation, our partners Datalight are now providing their corresponding percentage figures, i.e. the volatility, with market cap ratings relevant to the time of the statistical analysis having been written underneath:
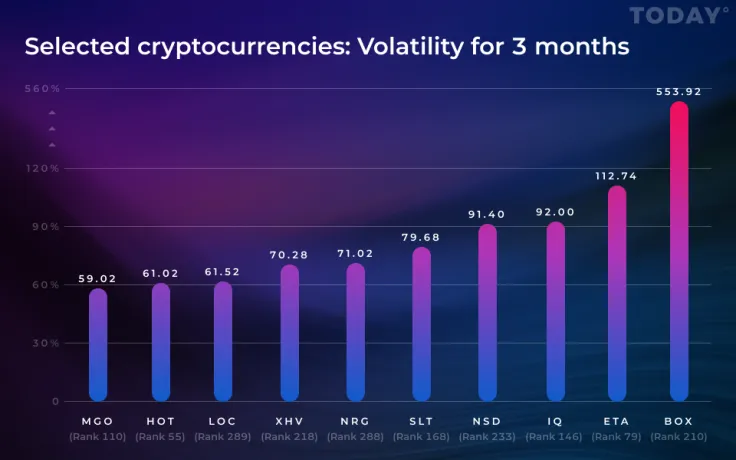
MobileGo (MGO), Holo (HOT), LockTrip (LOC) are all at around 60%; Haven Protocol (XHV) and Energi (NRG) are at around 70%; Smartlands (SLT) is at around 80%; Nasdacoin (NSD) and Everipedia (IQ) are at around 90%; Etheera (ETA) is at around 110%; and finally, Box Token (BOX) is at over 550%, very volatile indeed.
 Dan Burgin