
Disclaimer: The opinions expressed by our writers are their own and do not represent the views of U.Today. The financial and market information provided on U.Today is intended for informational purposes only. U.Today is not liable for any financial losses incurred while trading cryptocurrencies. Conduct your own research by contacting financial experts before making any investment decisions. We believe that all content is accurate as of the date of publication, but certain offers mentioned may no longer be available.
Following the Bitcoin breakout and subsequent spike to $47,000, various crypto market analysts, including veteran trader Peter Brandt, expressed their thoughts and analysis regarding the potential future movement of the first cryptocurrency.
Bitcoin spikes to $47,000
According to the provided chart and a pattern, Brandt expects a similar price movement for Bitcoin as we saw back when the cryptocurrency was trading around $4,000 and $8,000. Back then, BTC had a similar breakout from the symmetrical rangebound.
The $BTC pattern is called an ascending triangle (right). Read about Asc Tris in Schabacker, Study III, pgs 93-
— Peter Brandt (@PeterLBrandt) March 27, 2022
Also, compare present pattern to similar structure in 2019 (left) #Bitcoin pic.twitter.com/IyB2j7f8F6
Following the breakout in 2019, Bitcoin entered the ascending range after gaining approximately 20%, which ended up in another breakout that brought the digital gold to new local highs. The pump that came after resulted in a 50% price increase.
Despite showing quite similar historical movements, the veteran trader offered a disclaimer, warning the community that charts cannot predict the future. The provided charts and strategies are useful only within trading programs and strategies that require proper risk management.

He added that if $BTC cash tag "stalls and laser eyes reappear," traders should look out. The warning most likely refers to the greed phase on the market when the community around the market turns extremely bullish. Here, the probability of a long squeeze and sudden crash are increasing exponentially.
Bitcoin market performance
According to the chart by TradingView, Bitcoin has successfully broken through the resistance line of an ascending rangebound and now consolidates at around $47,000. The day's high is at $47,800.
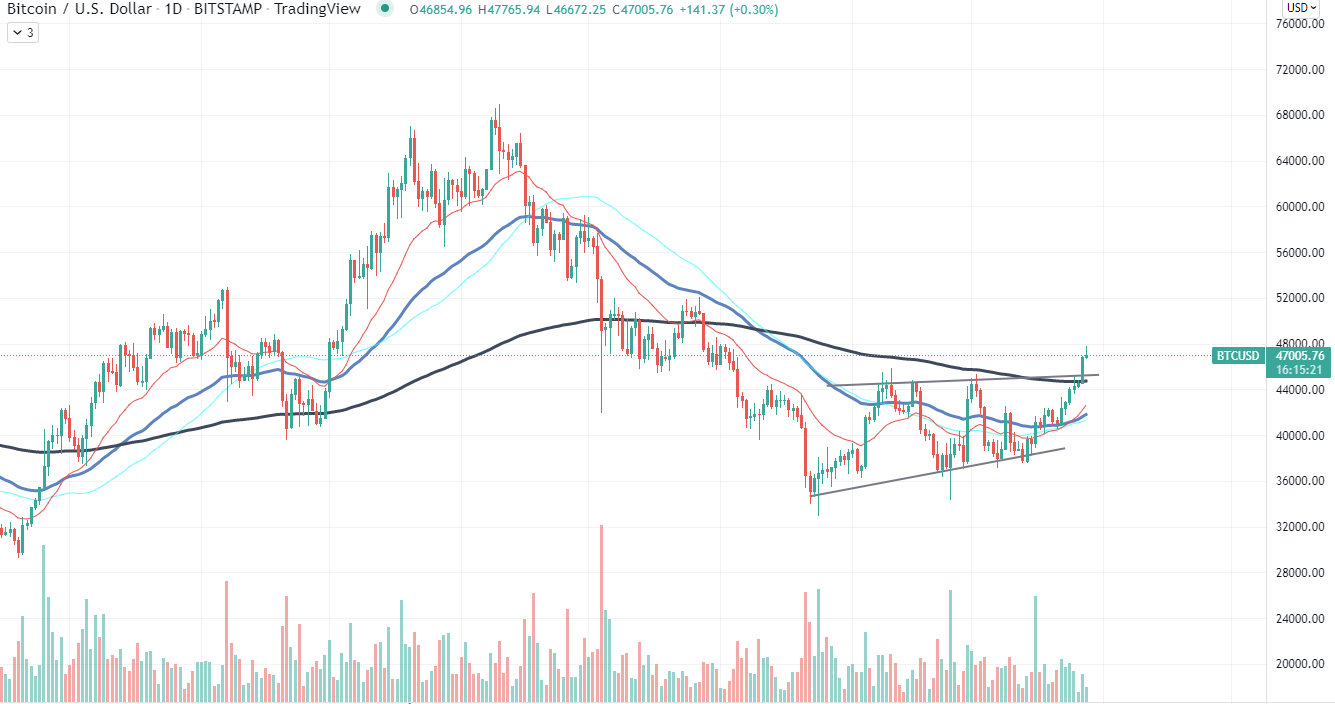
Besides breaking through the rangebound, BTC also moved through a 200-day exponential moving average, which has acted as a strong resistance since December 2021. At press time, Bitcoin trades at exactly $47,000.
 Dan Burgin
 U.Today Editorial Team