Disclaimer: The opinions expressed by our writers are their own and do not represent the views of U.Today. The financial and market information provided on U.Today is intended for informational purposes only. U.Today is not liable for any financial losses incurred while trading cryptocurrencies. Conduct your own research by contacting financial experts before making any investment decisions. We believe that all content is accurate as of the date of publication, but certain offers mentioned may no longer be available.
XRP token recently experienced a sharp decline that caught the attention of investors and traders alike. After a period of substantial gains, XRP has undergone a correction, prompting speculation about its next move.
The technical analysis of the XRP chart indicates that the asset has encountered a significant sell-off, with the price dropping precipitously over a short period. This sharp decline has led XRP to test key support levels that could determine the asset's short-term trajectory.
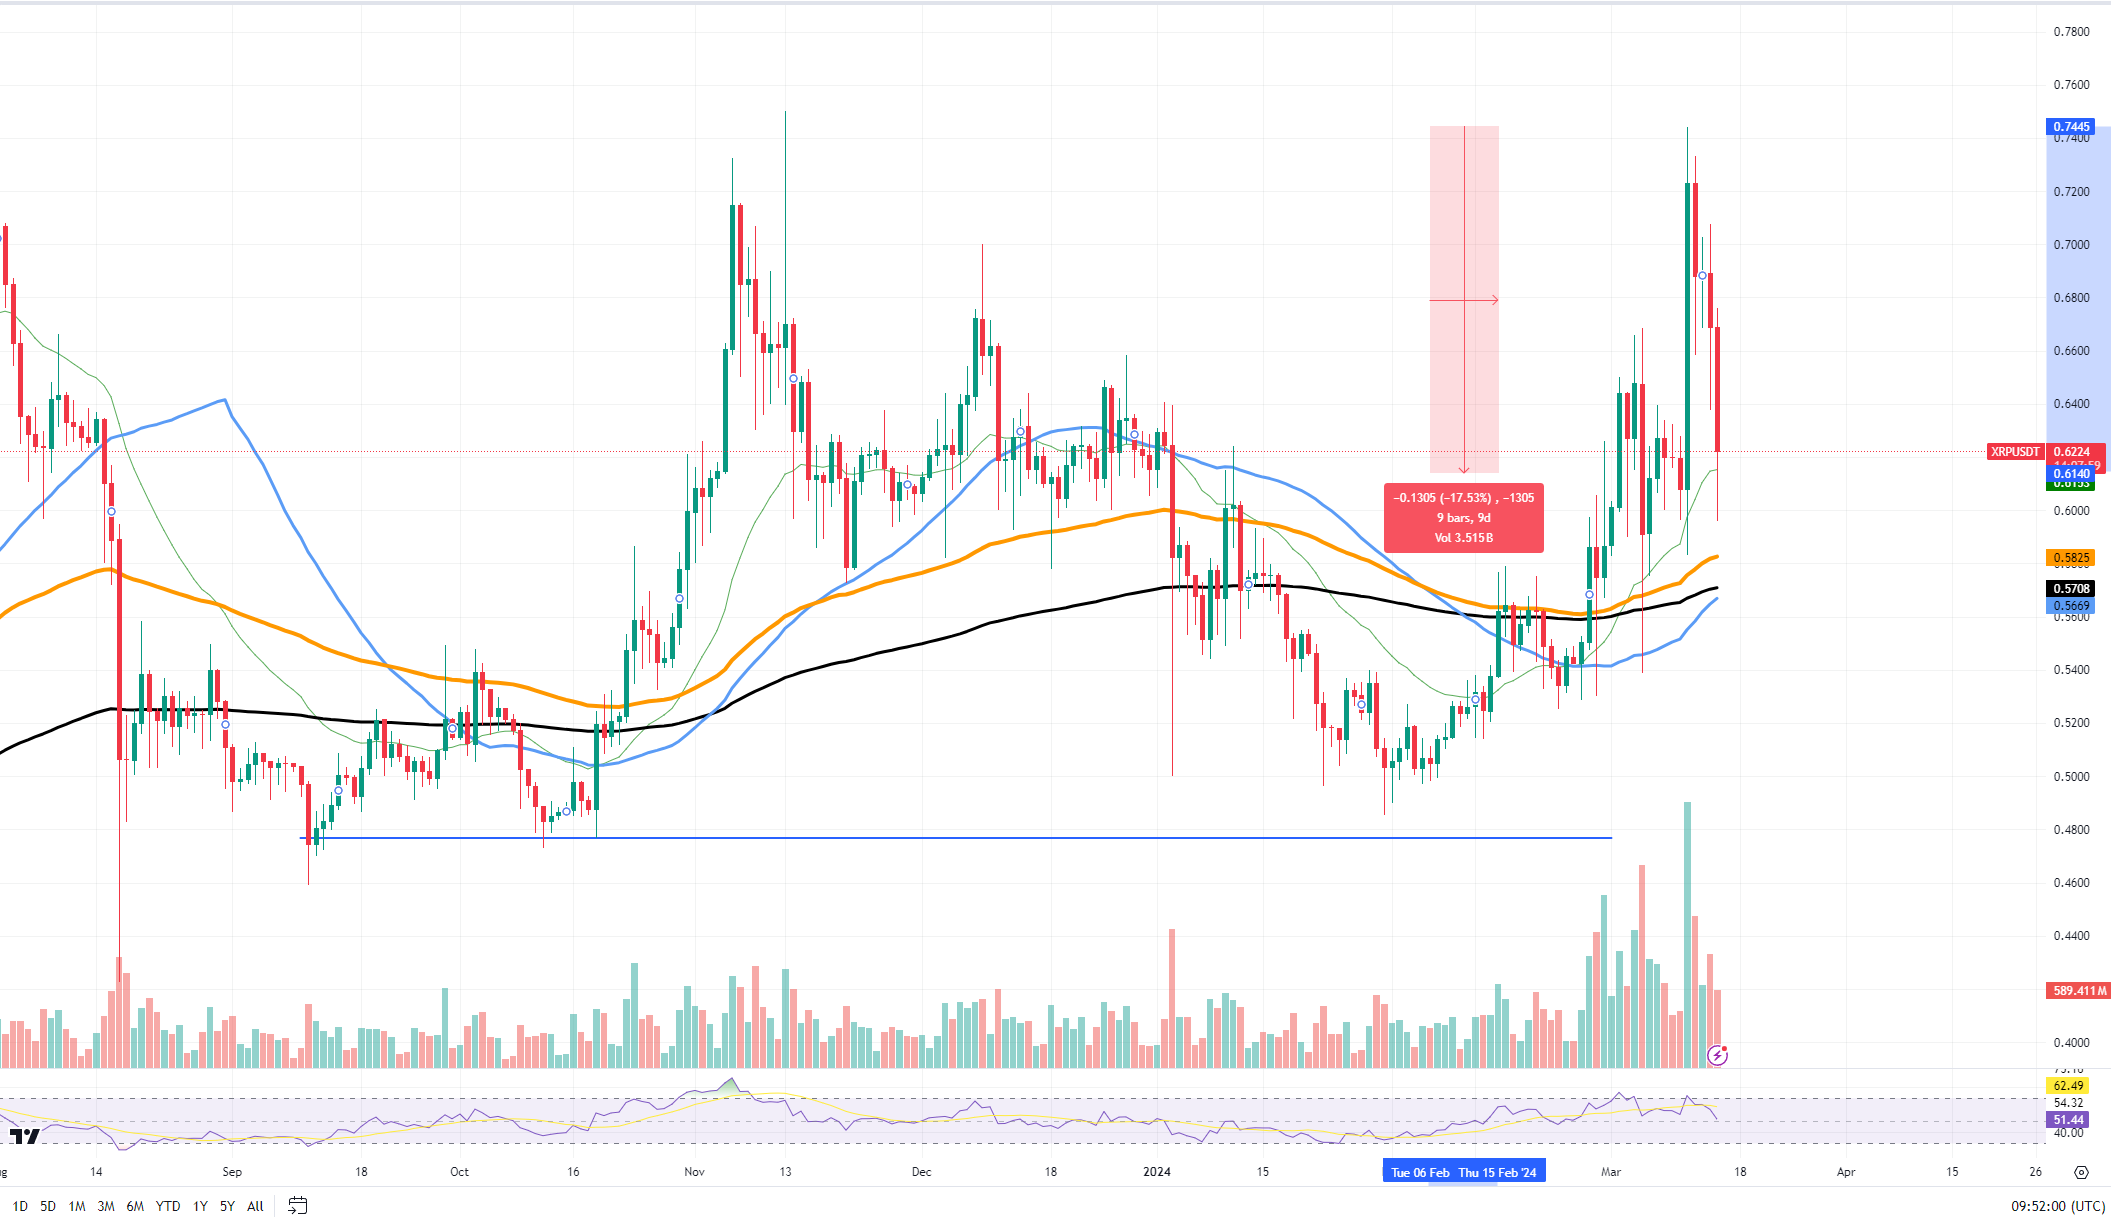
One critical local support level for XRP is currently found at around $0.58, a point that aligns with the 100-day moving average. This moving average has traditionally acted as a robust support level, and a bounce off this line could signal a possible recovery or consolidation phase. Should this support hold, it could provide a foundation for XRP's price to stabilize and potentially mount a comeback.

Conversely, resistance levels have formed at higher price points, particularly around $0.74, where XRP struggled to maintain upward momentum. This resistance level represents a significant barrier that XRP would need to overcome to reinitiate a bullish trend.
The volume indicator shows a spike during the sell-off, indicating a strong market reaction and possibly a climax of selling pressure. This could suggest that the market is flushing out weak hands and could be nearing a point of exhaustion.
Furthermore, RSI has dipped into oversold territory, which traditionally hints at an overselling of the asset and could foreshadow a potential reversal if market sentiment shifts. The RSI is a momentum oscillator that measures the speed and change of price movements, and its current position could indicate that the selling momentum is overstretched.
 Dan Burgin
 U.Today Editorial Team