Disclaimer: The opinions expressed by our writers are their own and do not represent the views of U.Today. The financial and market information provided on U.Today is intended for informational purposes only. U.Today is not liable for any financial losses incurred while trading cryptocurrencies. Conduct your own research by contacting financial experts before making any investment decisions. We believe that all content is accurate as of the date of publication, but certain offers mentioned may no longer be available.
XRP has shown underperformance compared to its peers, which paradoxically may signal a stronger potential for growth. Investors and analysts are eyeing the $0.7 mark as a key price point for XRP in March, based on several technical and market indicators.
Historical support and resistance levels
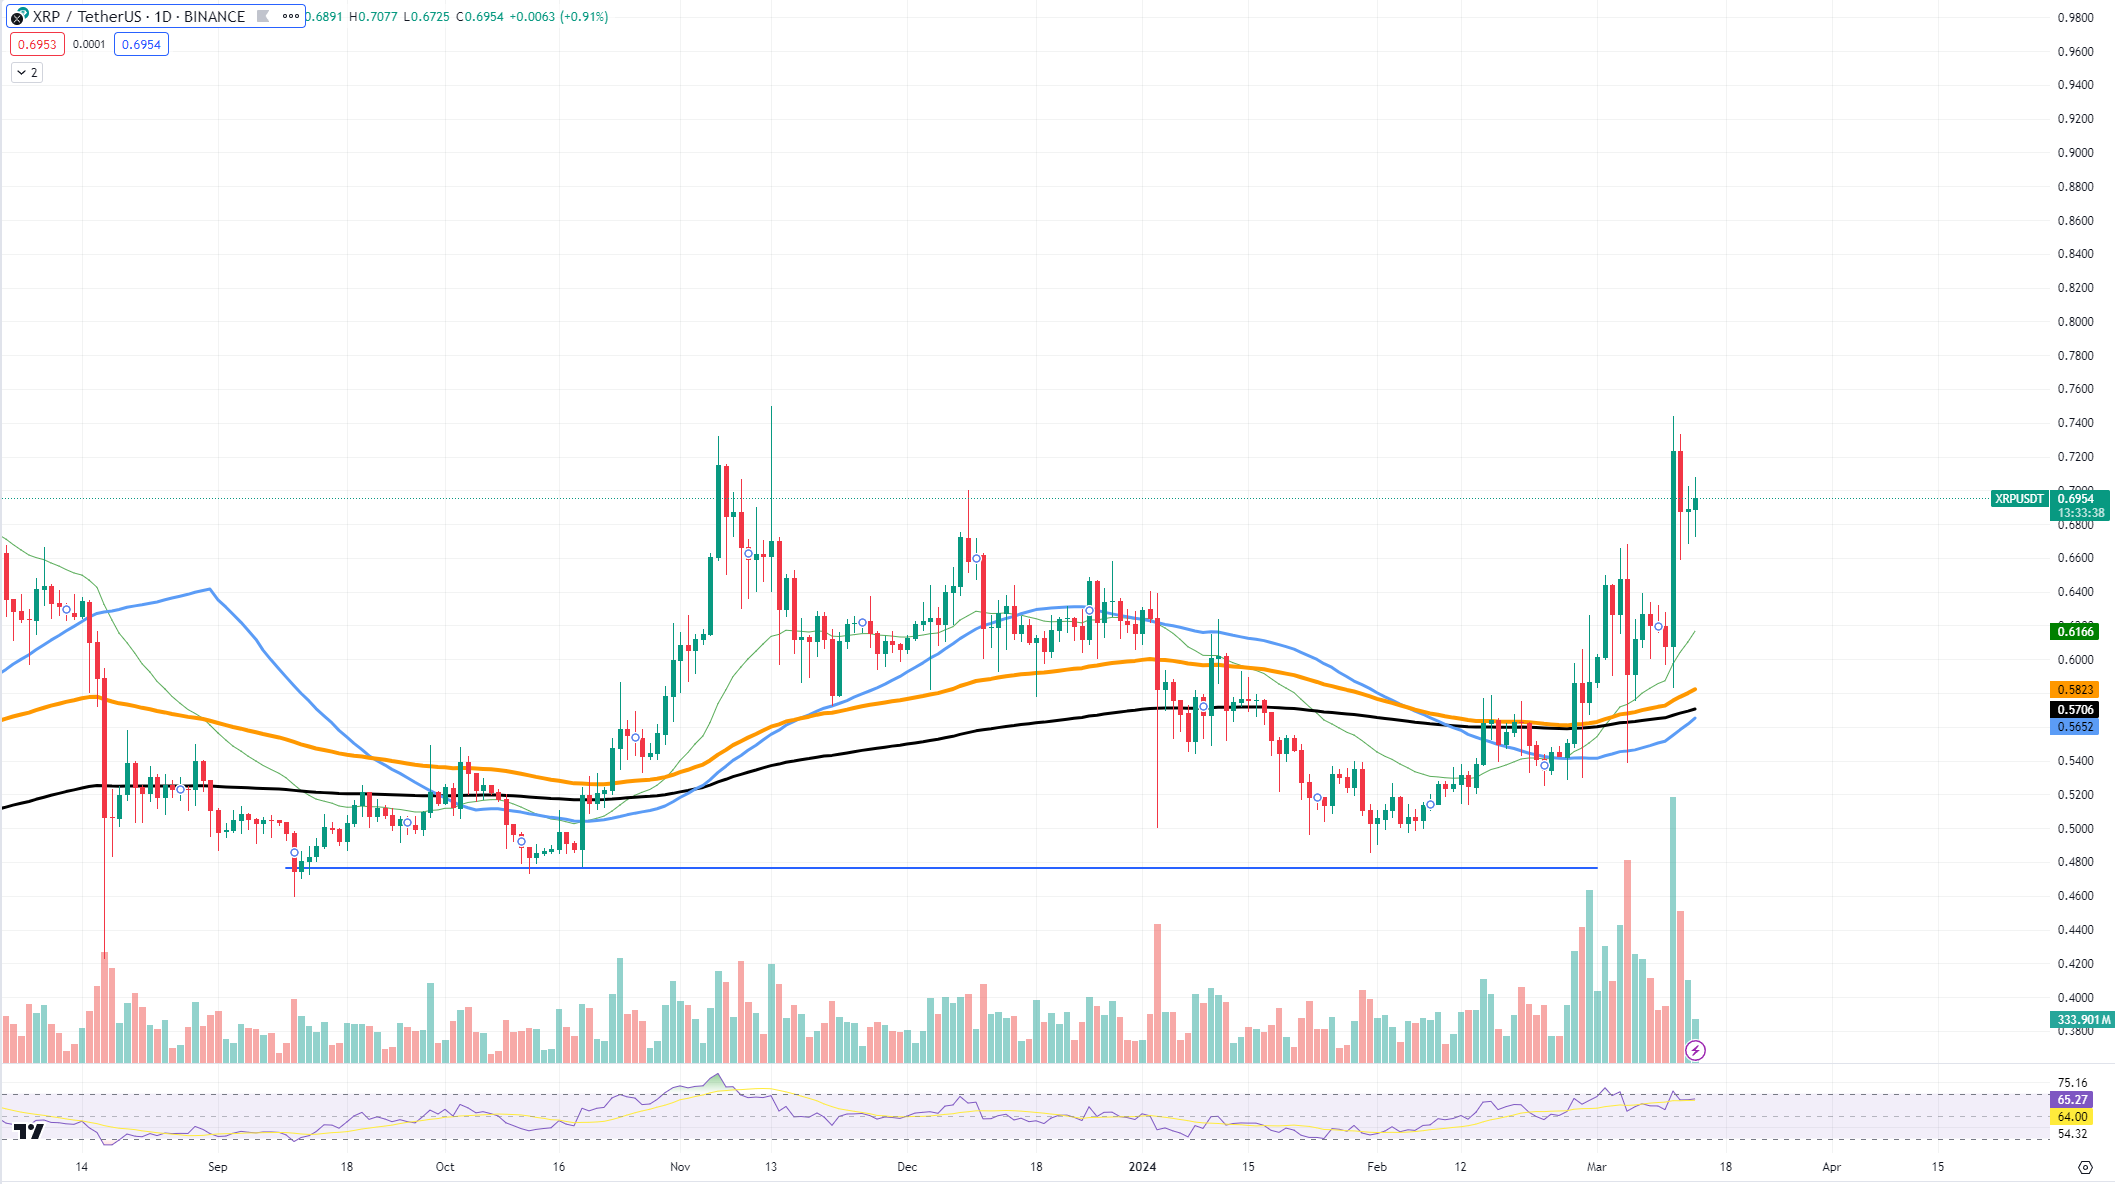
The recent price action of XRP reveals a pattern of resilience around the $0.5 support level, a point that has been tested and held firm several times in the past few months. This level serves as a springboard for potential price ascensions. Given this established support, a rebound from these levels could propel XRP toward the $0.7 resistance, a level that has previously acted as a significant psychological and technical barrier.

Underperformance as an opportunity
XRP’s price has not rallied to the same extent as some other assets, which have already hit their local or all-time highs. This relative underperformance can be seen as a coiled spring; with many assets already stretched in their valuations, XRP presents a comparatively attractive entry point for investors seeking growth opportunities.
Current market conditions may have created a consolidated base for XRP, making it ripe for a breakout to the upside as it catches up with the broader market rally. However, every breakdown in XRP's way may pose more risks for it, compared to assets like Ethereum.
Technical indicators and market sentiment
Technical analysis of XRP's chart shows a convergence of the short-term moving averages, indicating a tightening of price action and the potential for a breakout. While the longer-term moving average provides a strong support level below the current price, the shorter-term moving averages are trending upwards, suggesting a bullish continuation.

 Gamza Khanzadaev
 Arman Shirinyan
 Alex Dovbnya