Disclaimer: The opinions expressed by our writers are their own and do not represent the views of U.Today. The financial and market information provided on U.Today is intended for informational purposes only. U.Today is not liable for any financial losses incurred while trading cryptocurrencies. Conduct your own research by contacting financial experts before making any investment decisions. We believe that all content is accurate as of the date of publication, but certain offers mentioned may no longer be available.
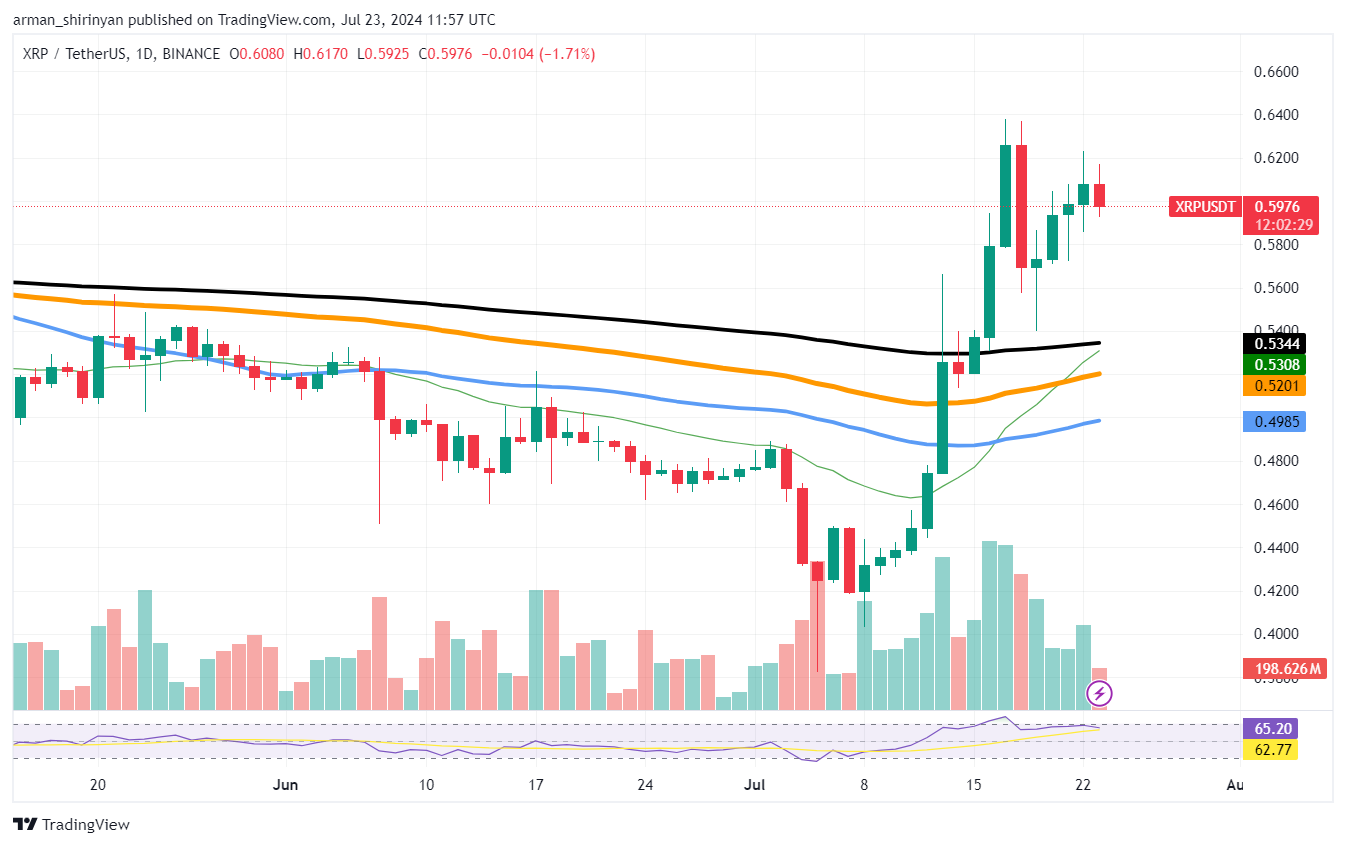
Despite the denial at the $0.62 price threshold, XRP's uptrend is pushing moving averages closer to a crossover, which could trigger a golden cross signal if the 50 and 200 EMA cross each other and potentially boost the asset's value.
When a short-term moving average crosses above a long-term moving average, it forms a golden cross, which is frequently interpreted as a bullish indication. The 50 EMA is getting closer to the 200 EMA in the case of XRP. The beginning of a long-term uptrend could be indicated if this crossover occurs.

Around $0.6 is where XRP is trading right now. Price has been pushing higher and bouncing off support levels in the most recent price action, indicating strong upward momentum. As the 200 EMA continues to slope downward, the 50 EMA is trending upward, suggesting short-term strength.
It is also crucial to keep an eye on the 100 EMA and 26 EMA. A positive short-term outlook is suggested by the 26 EMA's position above the 100 EMA. The likelihood of a golden cross scenario is strengthened by the convergence of these EMAs close to the current price level.
Bitcoin's crucial pattern
Bitcoin's reversal at around $66,000 could create a basis for a head and shoulders pattern formation. On the downside, there is a possibility of a 50 and 100 EMA cross, which is often considered a predecessor of further price drops.
A well-known chart pattern that denotes a change in trend from bullish to bearish is the head and shoulders pattern. The left shoulder, the head (the highest peak) and the right shoulder make up its three peaks. The way that Bitcoin has been trading lately points to the possibility that it is starting to form this pattern with the current peak, which is at $66,000, possibly serving as the head.
There may be more bearish momentum indicated if the 50 EMA crosses below the 100 EMA. The price of the asset may be under pressure to decline, and this crossover is usually interpreted as a warning. The price of Bitcoin is currently close to $66,944. It bounced off the 200 EMA during the most recent upward movement, indicating that this level serves as strong support.
A more significant correction, though, might result if the price is unable to hold above this level and the EMAs cross. You should also keep an eye on the short-term 26 EMA. It is currently showing short-term strength because it is above the 50 and 100 EMAs. This position could, however, shift in favor of the possible head and shoulders formation, indicating weakening momentum. These technical signals are closely monitored by traders. The head and shoulders pattern and the EMA crossover may shed light on where Bitcoin is likely to go in the future.
Solana still aims high
Solana is still moving in an uptrend, but the most recent reversal at $180 could have raised some questions and suspicions. But becoming bearish on SOL could be premature.
At the moment, SOL is trading at about $177. Although the recent decline from the $180 mark may seem alarming, the general trend seems to be strong. Key indicators to keep an eye on are the 50 EMA and 100 EMA. It is generally considered a bullish signal when the 100 EMA attempts to cross above the 50 EMA.
One sign of increasing momentum and possibly a move in the price higher is the crossover of the 100 EMA above the 50 EMA. Given this configuration, it is possible that the uptrend will continue and push SOL through $200. Another significant component is the 26 EMA, which is presently trending upward and indicating short-term strength. An important area for SOL has been the $135 mark, which is the 200 EMA and offers a strong support level.
It is critical for traders to keep a careful eye on these moving averages. Potential gains could be indicated by a successful crossover between the 100 and 50 EMA. But it is also critical to monitor more general market trends and outside variables that might affect SOL's pricing.


 Vladislav Sopov
 Dan Burgin