
Disclaimer: The opinions expressed by our writers are their own and do not represent the views of U.Today. The financial and market information provided on U.Today is intended for informational purposes only. U.Today is not liable for any financial losses incurred while trading cryptocurrencies. Conduct your own research by contacting financial experts before making any investment decisions. We believe that all content is accurate as of the date of publication, but certain offers mentioned may no longer be available.
Despite the popularity of death and golden crosses, some movements of Exponential Moving Averages also provide serious volatility to the market by pushing the price in one or another direction. In Shiba Inu's case, those are 21 and 50 day moving averages.
The 21 and 50 EMA cross are generally considered a bullish signal, especially when the 21 EMA crosses above the 50 EMA. This could indicate a potential uptrend in the short term. However, it is essential to note that this is a more volatile and less commonly used indicator compared to the 50 and 200 EMA crosses, which are often considered more reliable for long-term trends.
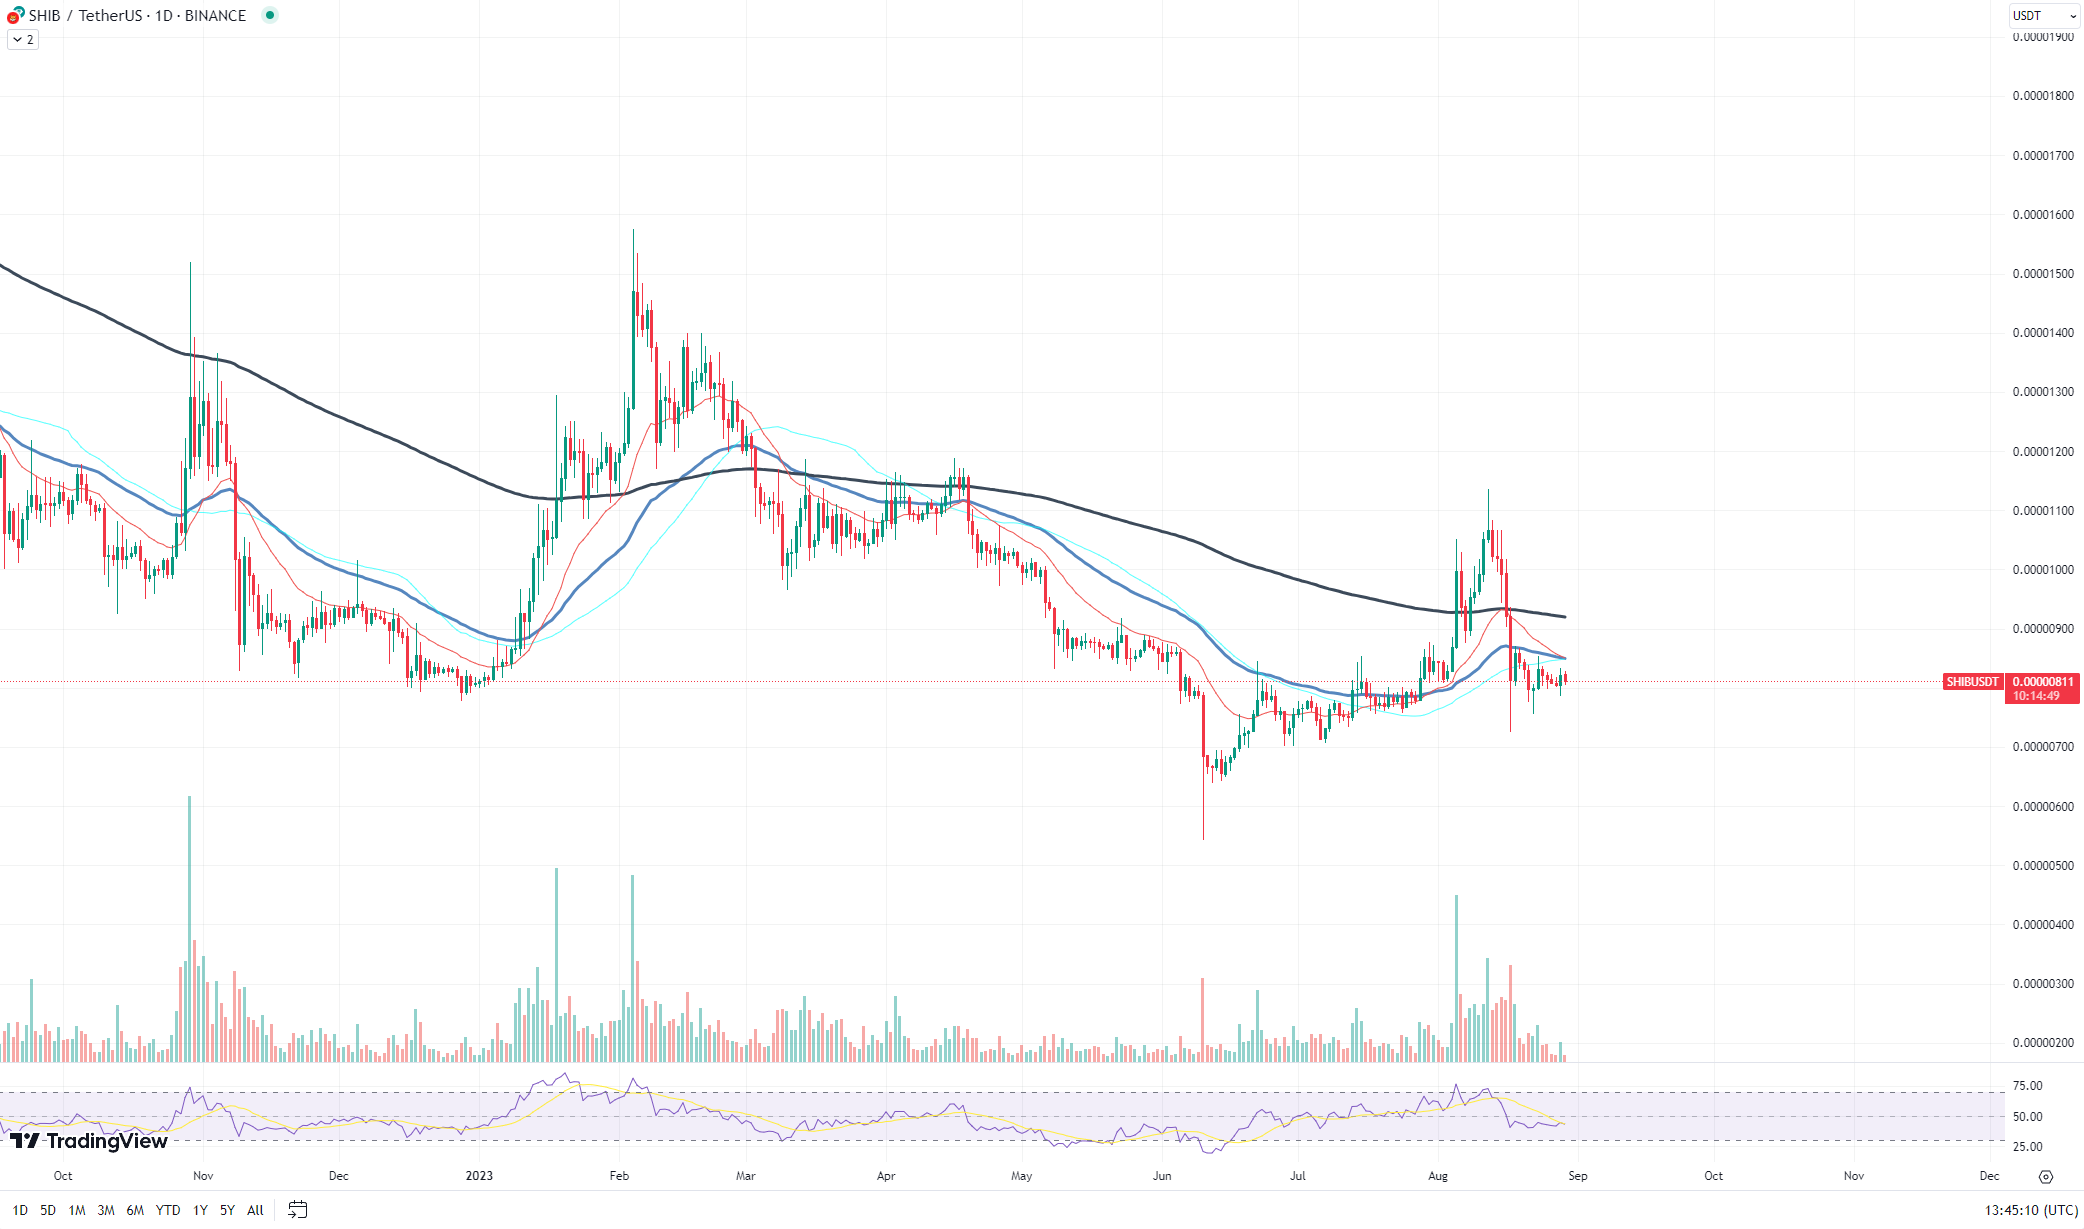
As for Shiba Inu's current price, it stands at approximately $0.00000813, as of the latest data. The asset has been experiencing a lack of volatility recently, which could make this EMA cross even more significant. A sudden increase in trading activity following this technical indicator could lead to a short-term price surge.
Interestingly, the lack of volatility on Shiba Inu's price comes at a time when the overall altcoin market seems to be losing traction. This could mean that traders and investors are waiting for a clear signal or catalyst to jump back into the market. The hidden EMA cross could very well serve as that catalyst, especially if it is followed by increased trading volume and bullish momentum.
Cardano's RSI not backing down
Cardano (ADA) is currently trading at $0.2633, and it is showing some intriguing patterns that could be indicative of future price movements. One of the most notable metrics is the Relative Strength Index (RSI), which is moving upward even as the price of ADA is trending downward when measured from the peaks.
Adding another layer to this analysis is the declining trading volume. Lower volume often indicates a lack of investor interest, but when combined with a bullish RSI divergence, it could mean that the market is quietly accumulating before a potential upward move.

The RSI divergence is particularly interesting because it is not a common occurrence and often precedes significant price movements. In the case of ADA, the divergence is firm and has been consistent over a period, making it a metric worth watching closely.
However, it ia essential to consider that the RSI is just one indicator, and relying solely on it would be unwise. Other factors, such as market sentiment, news and overall market conditions, should also be taken into account. But the RSI divergence, especially when combined with declining volume, does provide a compelling narrative for potential bullish action.
Solana enters falling channel
Solana (SOL) has been in a midterm bear market, but a descending price channel pattern could be a strong starter for a potential turnaround. As of the latest data, the price of SOL stands at $20.27, and it is worth noting that the trading volume has been on a decline.
The descending price channel is a bearish pattern, but it often acts as a reversal pattern when it appears after a downtrend. In Solana's case, the price has been moving downward and has recently formed a steep descending channel. This could be a precursor to a potential breakthrough. The declining volume accompanying this pattern further substantiates the possibility of a reversal. Typically, a decrease in volume is a sign that sellers are losing strength, which could pave the way for buyers to step in.
Adding another layer to the analysis is the Relative Strength Index (RSI). While the price has been moving downward, the RSI has been showing signs of upward movement when measured from its peaks. This divergence between the RSI and the price is a bullish indicator and could signal a potential reversal in the near future.
However, it is crucial to approach this setup with caution. A breakout from the descending channel would need to be confirmed by an increase in volume and a sustained move above the upper boundary of the channel. If Solana fails to break out, the price could continue its downward trajectory, possibly seeking new lows.
 Dan Burgin
 U.Today Editorial Team