
Disclaimer: The opinions expressed by our writers are their own and do not represent the views of U.Today. The financial and market information provided on U.Today is intended for informational purposes only. U.Today is not liable for any financial losses incurred while trading cryptocurrencies. Conduct your own research by contacting financial experts before making any investment decisions. We believe that all content is accurate as of the date of publication, but certain offers mentioned may no longer be available.
Despite volatile waves on the crypto market, Shiba Inu (SHIB), one of the most prominent "meme coins," is struggling to break into a sustained uptrend. The primary hindrance lies in the liquidity crisis, a low total value locked (TVL) and unappealing APYs offered by liquidity pools, all of which signal a lack of demand for SHIB as an LP.
SHIB's liquidity crisis manifests in the constrained volume of its tradable tokens. Without ample liquidity, the asset's stability is compromised, discouraging potential investors and causing current holders to reconsider their stakes. This stagnation is a key barrier to SHIB's upward price momentum.
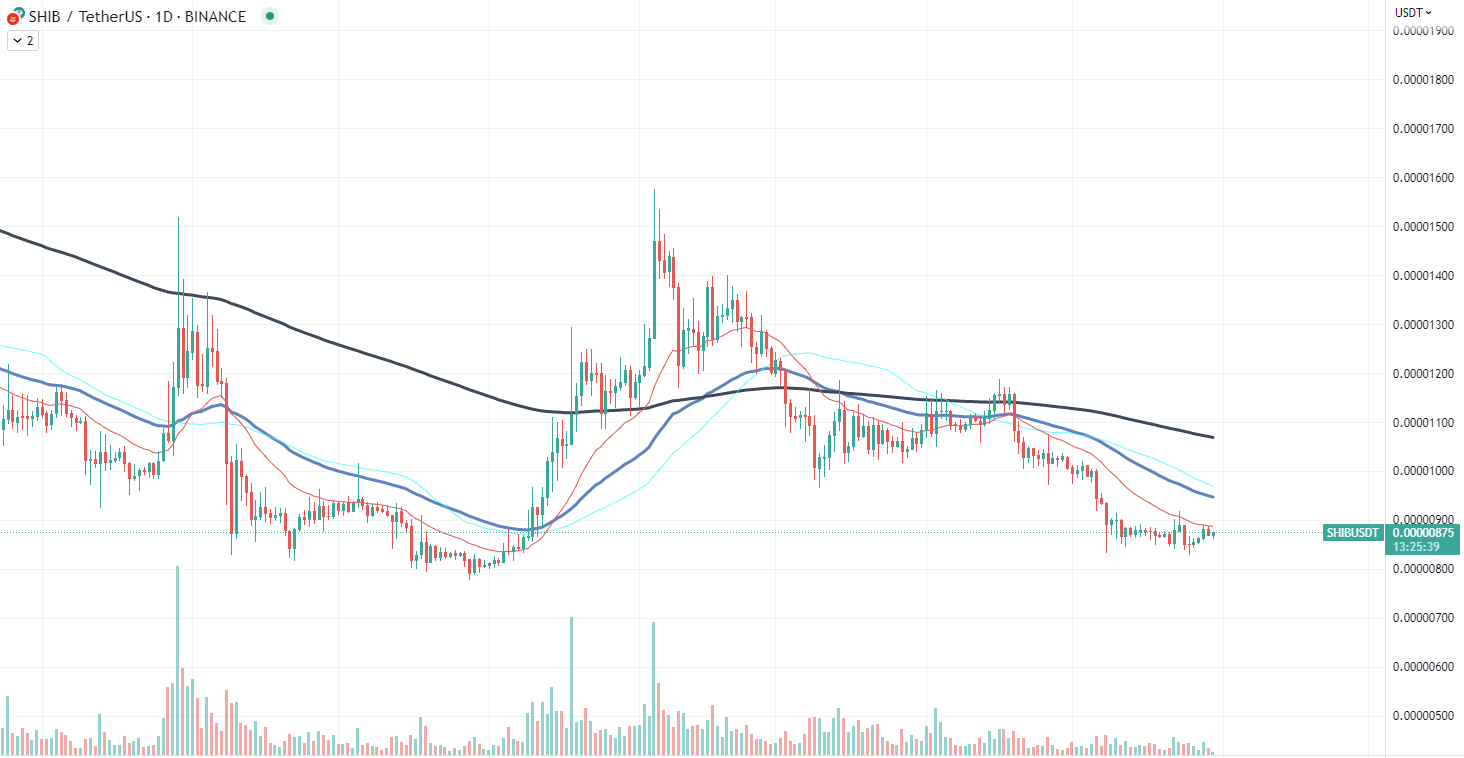
Moreover, the low TVL of SHIB is another concerning factor. The TVL represents the total assets staked in a cryptocurrency's network or DeFi protocol. A low TVL indicates reduced activity on the network and is often interpreted as a lack of investor trust in the asset's potential for yield. This inactivity deters new investors, thereby suppressing SHIB's price growth.
Finally, the disappointing APYs offered by various liquidity pools further compound the problem. With lower-than-average returns, liquidity providers are not incentivized to stake SHIB in DeFi pools.
Binance ecosystem grows
Binance Coin (BNB), the native token of the Binance Exchange and Binance Smart Chain, appears poised for an 11% rally following a remarkable surge in network growth.
BNB, currently trading at $312, a low point unseen in the last 75 days, has been going through a relatively quiet phase. However, a noticeable uptick in network activity signals a potential turnaround for the cryptocurrency. A surge in the number of deployed and launched projects on the Binance Smart Chain (BSC) is bolstering the strength of its native token.
BSC's performance has always had a direct correlation with BNB's price trend. As more projects choose BSC for its efficiency and cost-effectiveness, the demand for BNB naturally increases, providing a strong backbone for its price. This phenomenon is even more pronounced in the DeFi sector, where BSC projects like PancakeSwap have dominated the market, propelling BNB to new heights.
The rapid expansion of BSC is a testament to the adaptability and versatility of the Binance ecosystem. As the network continues to grow, it is creating a thriving environment that may translate into a significant price push for BNB.
Considering current market conditions, an 11% price surge might be on the horizon. Despite trading at a 75-day low, the growing strength of the Binance ecosystem could fuel a bullish comeback. Traders and investors should keep a close eye on BNB's movement in the coming days, as a sudden trend change could spark a new rally.
Cardano's bounce potential
Recent technical data has indicated that Cardano (ADA), one of the leading decentralized cryptocurrencies, is showing signs of braking its recent downward trend. This comes after ADA's successful bounce off the local trendline situated around $0.35, with subsequent movement steering it gradually upward. However, this potential change in trend still lacks full market support, as evidenced by the persistently declining trading volume.

In technical analysis, the movement of an asset above key lines, such as the 50-day and 200-day Exponential Moving Averages (EMA), often indicates a potential shift in market trend. This is precisely what ADA has achieved, breaking above both EMA lines, hinting toward a potential cessation of its local downtrend and a possible further climb.
Yet, the descending trading volume that ADA is currently experiencing acts as a countersignal. A healthy rally is typically supported by increasing volume, signifying active investor participation and market conviction in the ongoing trend.
The dynamics of market price and volume trends require careful monitoring as they provide essential insights into potential future movements. In the case of ADA, the mismatch between price trends and trading volumes calls for caution.
 Dan Burgin
 U.Today Editorial Team