
Disclaimer: The opinions expressed by our writers are their own and do not represent the views of U.Today. The financial and market information provided on U.Today is intended for informational purposes only. U.Today is not liable for any financial losses incurred while trading cryptocurrencies. Conduct your own research by contacting financial experts before making any investment decisions. We believe that all content is accurate as of the date of publication, but certain offers mentioned may no longer be available.
Currently, ETH is carving out what appears to be an ascending channel, a structure that could signal a steady climb toward $4,000.
The ascending channel is outlined by two upward sloping parallel lines on the chart. This pattern captures the swings of the price between higher highs and higher lows, showcasing a gradual but consistent upward trend.
For Ethereum, the lower line of the channel seems to be providing a stepping stone from which the price bounces back up, and the upper line is where the price peaks before retreating slightly.
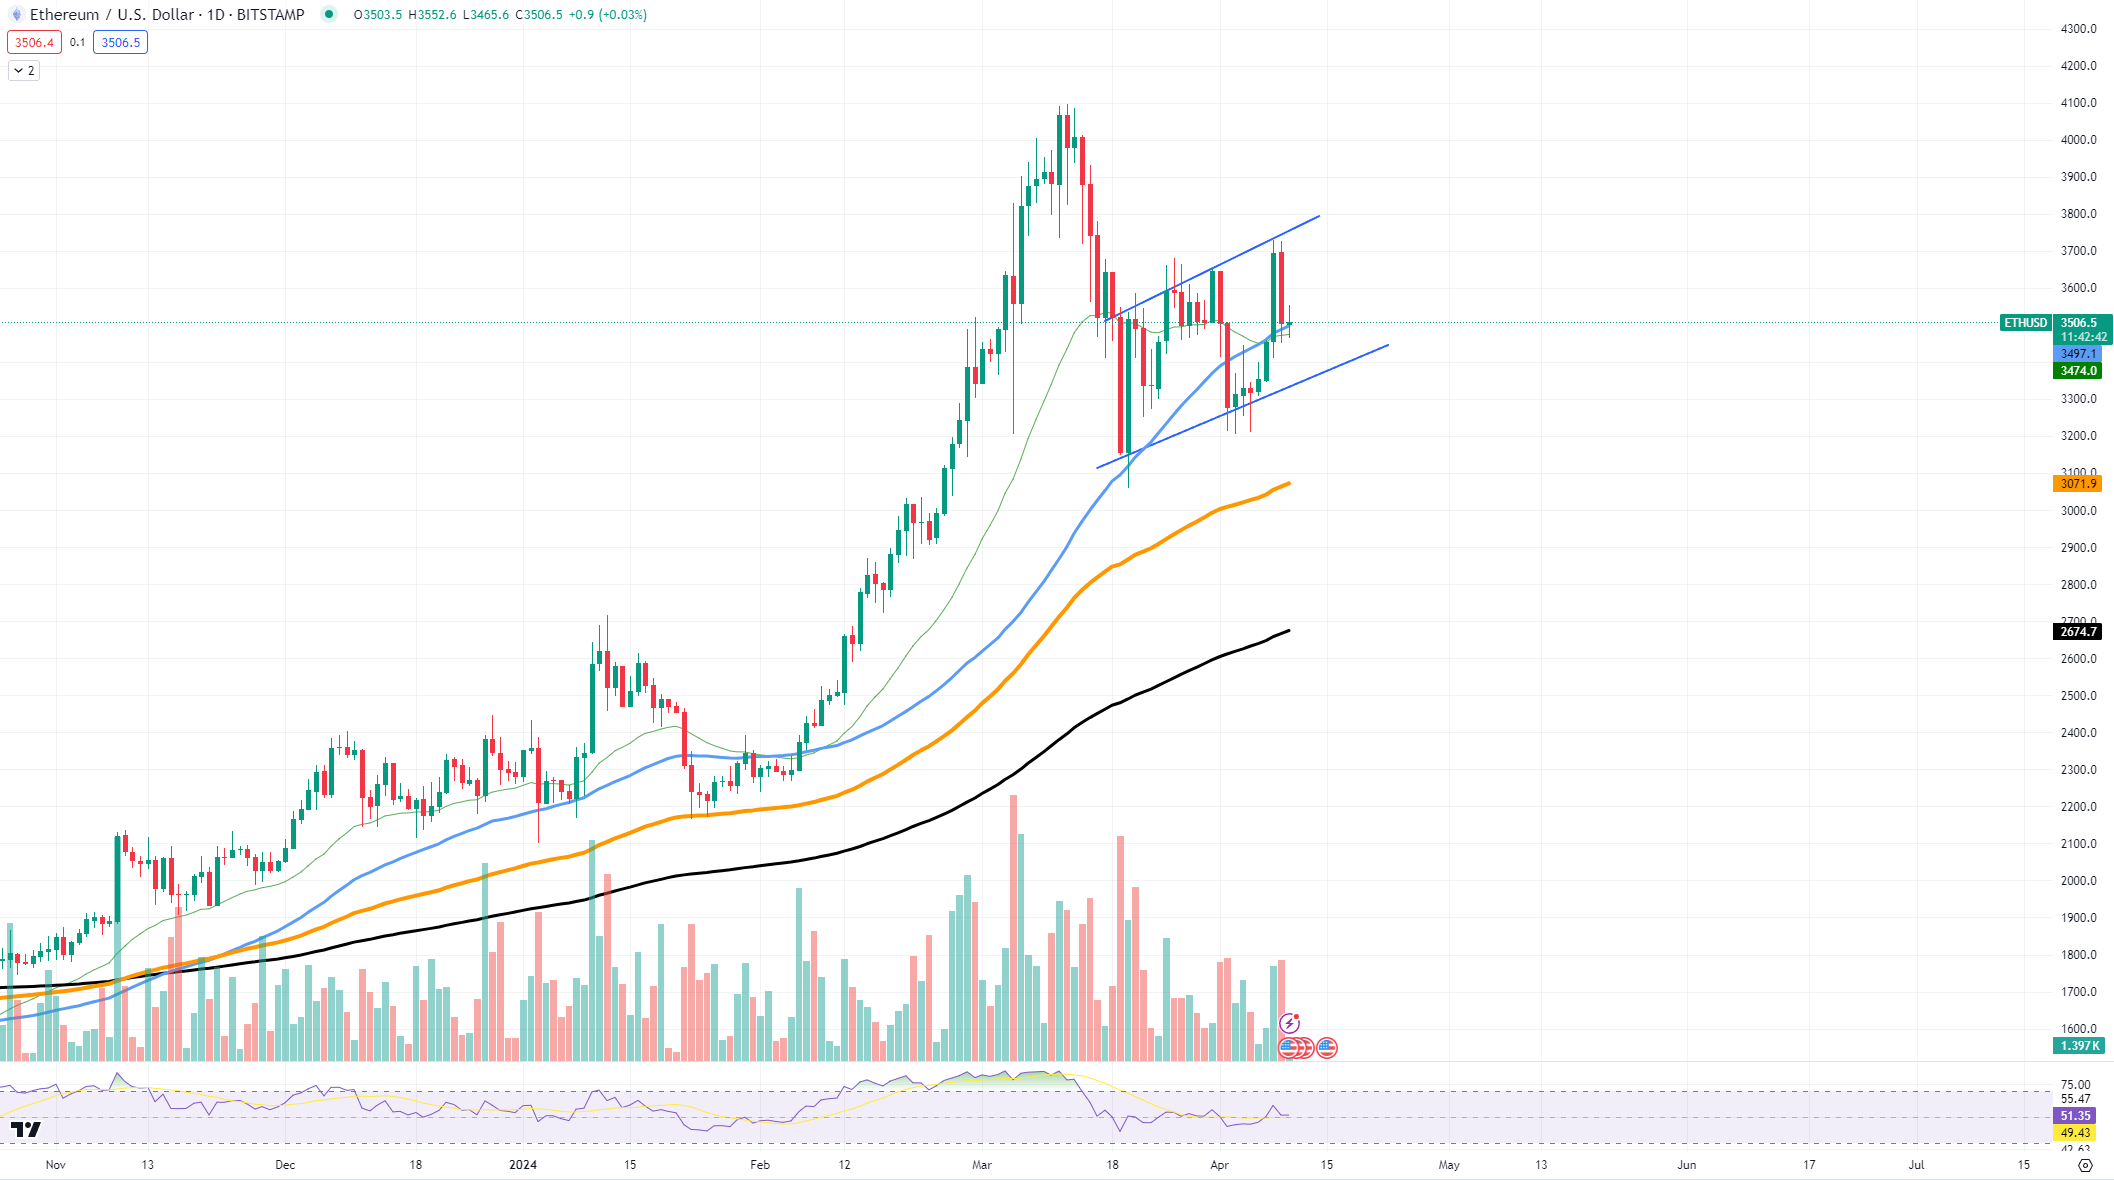
A key level to watch is the recent resistance Ethereum has encountered near the $3,500 level. A decisive push past this point could pave the way for a test of higher resistances, ultimately aiming for the channel's upper boundary and beyond to $4,000. Currently, the chart shows Ethereum hovering around $3,500, which aligns with the channel's midpoint — a crucial area for bulls to defend.
On the support side, the $3,072 mark stands as the channel's lower boundary. As long as the price remains within the confines of the channel, optimism remains. A dip below, however, could signal a need to reassess the bullish scenario.
Looking ahead, the main goal for Ethereum is to maintain its momentum within this ascending channel. A breakout above could confirm the bulls' strength, leading to a significant rally. On the flip side, a breakdown could shift market sentiment.
Shiba Inu's positive dynamic
Shiba Inu is showing the possibility of a volatility explosion as the asset is on the verge of reaching the tip of the aforementioned formation. This pattern is formed when the price of an asset consolidates within converging support and resistance lines, hinting that a significant price move could be on the horizon — either a sharp rise or a decline.
The pattern's apex draws nearer, suggesting that a big move is imminent. Symmetrical triangles are notorious for their unpredictability in terms of direction. The breakout could lead to a surge in price if it moves upward or a fall if it breaks down.
Currently, SHIB is trading within a tight range, and the specific price to watch is the triangle's upper boundary, around $0.00002776. A consistent move above this level could signal a breakout to the upside, with the next resistance possibly forming near the $0.00002987 mark. Conversely, if SHIB breaks below the triangle's lower support at $0.00002515, it may experience a downturn, with the next level of significant support at $0.00002236.
The future of SHIB, within this symmetrical triangle, remains unclear, and so does the direction of the token and its future. SHIB might leverage this pattern for a bullish breakout if the market remains bullish.
Cardano on reversal point
Cardano's indicators suggest an upcoming reversal. The asset has reached a crucial price level that, in the past, has served as a beginning point of a bullish reversal.
ADA is hovering around the $0.57 mark, a significant level that has historically acted as a pivot point. This price acted as a strong support in previous trading sessions, hinting at the potential for a bounce back. The critical resistance to overcome for a solid reversal stands at $0.62 which, if broken, could see ADA rally toward the next resistance point at $0.65.
If ADA fails to maintain this support level, the next significant floor is expected near the $0.5266 mark, where buyers may reemerge to bolster the price. This zone remains crucial for the bulls to defend to prevent further declines that could dampen the short-term outlook for ADA.
A successful rebound from the current support could validate Cardano's readiness to climb. An upswing backed by increased trading volumes and positive market sentiment could carry ADA to retest its recent peaks and potentially establish new ones.