Disclaimer: The opinions expressed by our writers are their own and do not represent the views of U.Today. The financial and market information provided on U.Today is intended for informational purposes only. U.Today is not liable for any financial losses incurred while trading cryptocurrencies. Conduct your own research by contacting financial experts before making any investment decisions. We believe that all content is accurate as of the date of publication, but certain offers mentioned may no longer be available.
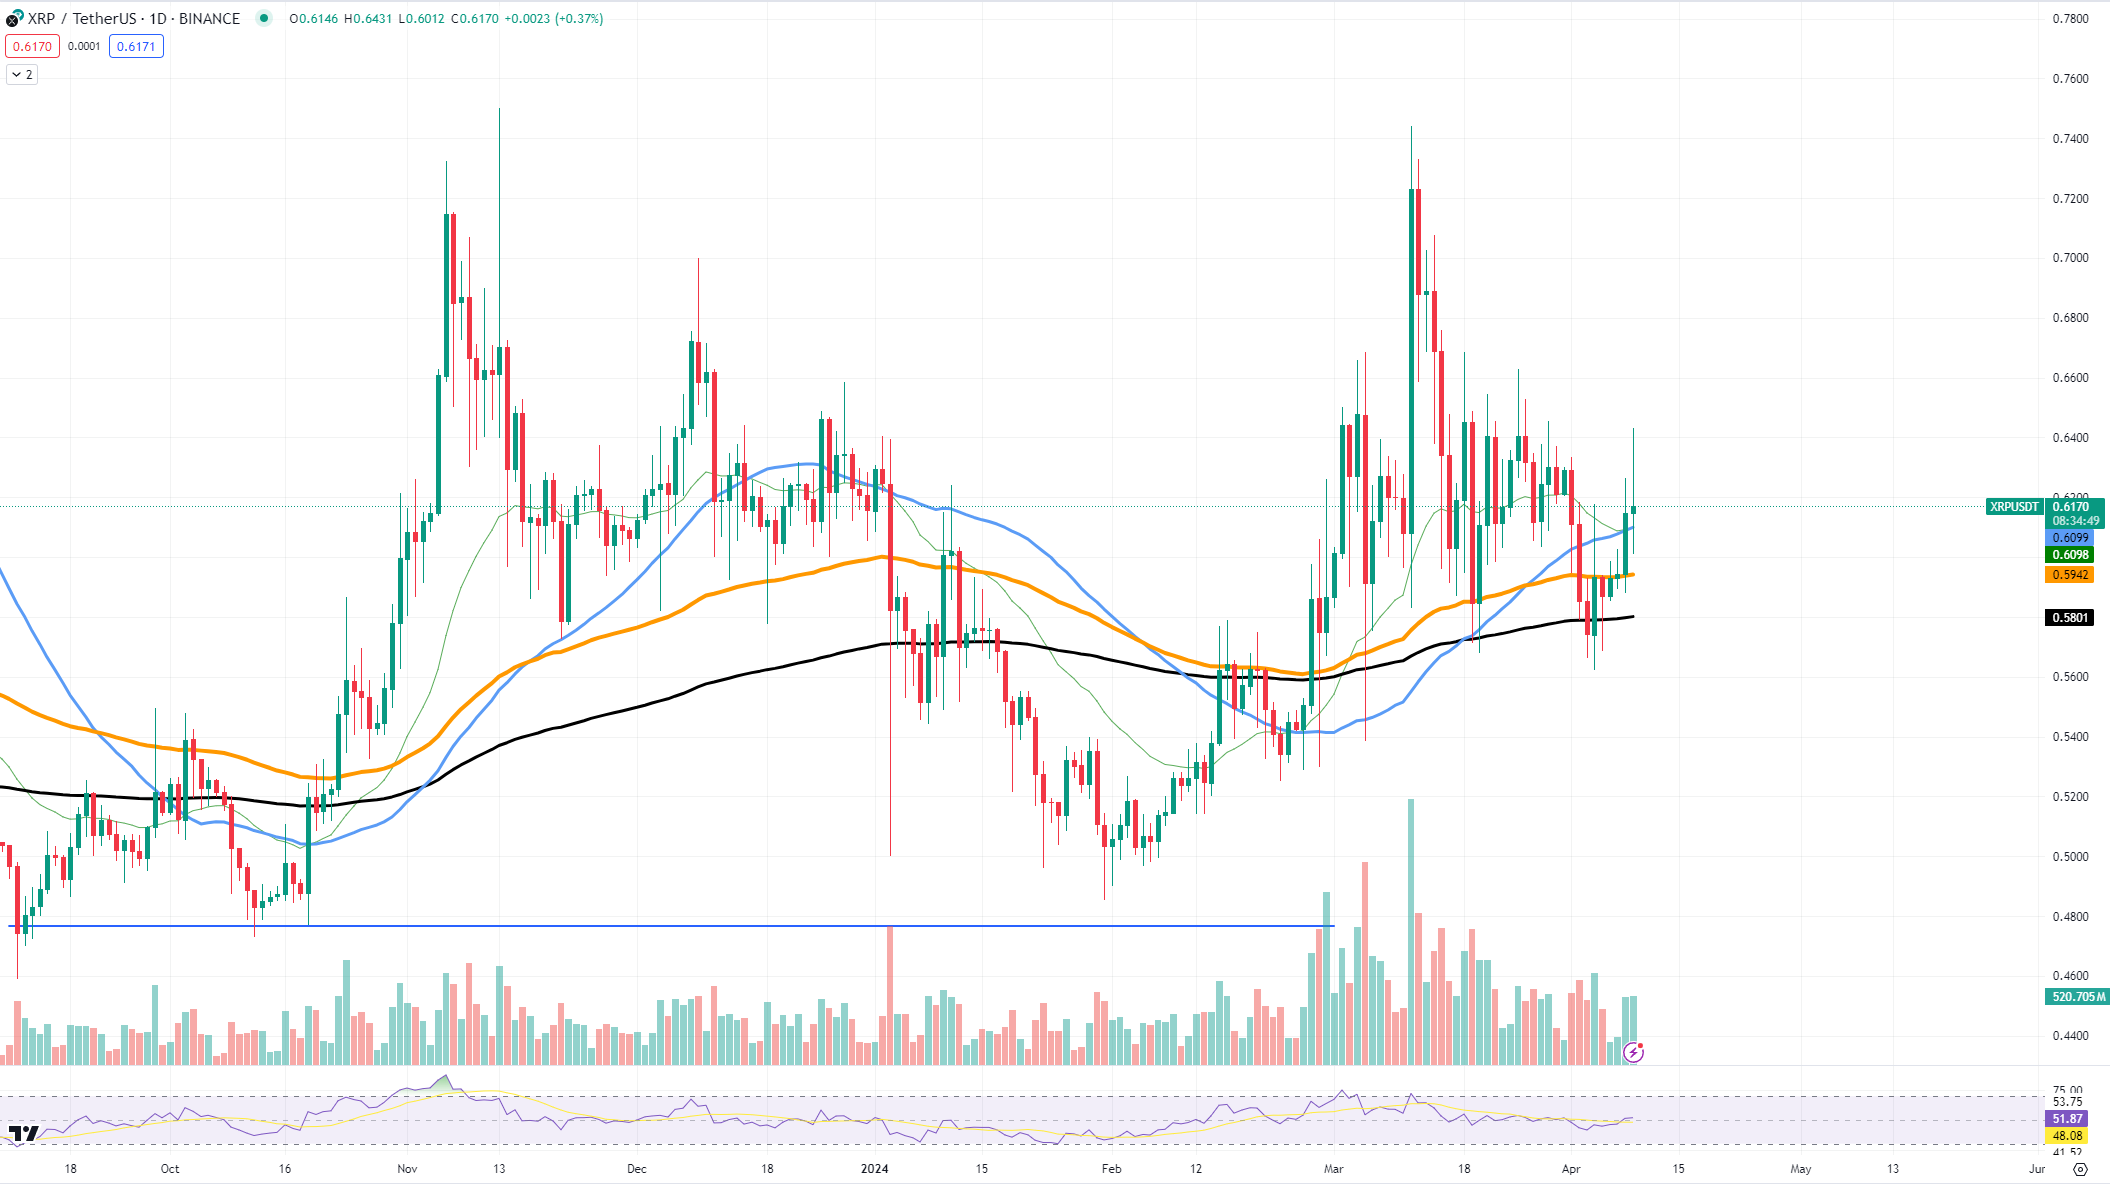
XRP recently passed the 50-day Exponential Moving Average with ease. It acts as a deciding line between the bullish and bearish territories, and XRP's leap over it is a strong signal itself.
With XRP's price now comfortably above the 50 EMA, it is eyeing the next resistance level at $0.64. The current trading momentum suggests that if the broader market maintains its upward trend, XRP is well positioned to challenge and potentially surpass this resistance. The local peak — or the highest point the price has reached recently — sits at $0.74, and that is where traders might set their sights if the $0.64 barrier is broken.

However, while the market as a whole may continue to gain momentum, there is a possibility that XRP cannot muster enough strength on its own to keep up with the pack. Its performance has been somewhat mixed, so despite the technical signals, some caution among investors remains.
Maintaining its stance above the 50 EMA, which it has crossed with relative ease, will be vital to continuing its growth. The strength of this move is evident, but for further gains, maintaining this level is key.
If the general market trends stay positive and XRP holds above the EMA, we may very well see it aiming for that local top of $0.74. Should it break that level, it opens up the possibility of reaching new highs for the year. However, it is essential to note that XRP's journey is not just dictated by market sentiment but also by its unique place in the financial ecosystem, which can sway its price independently from market trends.
Ethereum back in the game
Could Ethereum be gearing up for a rally that will push its value beyond the $3,700 threshold, clearing the path toward $4,000? The comeback it made was quite unexpected considering the relatively weak performance of the second-biggest asset on the market.
Currently, Ethereum is showing signs of entering breakthrough mode, trading at a promising juncture. Technical analysis of the price chart shows Ethereum testing the significant $3,700 level. This price acts as a gatekeeper, which, if crossed, could signify a strong upward trend. A successful leap past this level could solidify investor confidence, further fueling the rally.
The next key resistance will be found at $3,700. Should Ethereum surpass this mark, it might encounter some friction around $4,000, which represents a psychological ceiling as well as a technical resistance level.
Cardano paints candlestick pattern
ADA token recently displayed a reversal pattern known as a bearish harami. This pattern suggests that ADA's recent attempt to push higher may be losing steam, hinting at a possible reversal.
The reversal occurred right after ADA managed to break through a key level, indicating resistance from the market against allowing its price to climb further. Currently, ADA seems to be in a delicate position, with the potential for a decline. The lack of bullish momentum is evident, as the crypto community has not seen enough positive signals to propel ADA’s price upwards.
However, Cardano's fate is not solely in its own hands; it is intertwined with the broader market's movements. Should the general market sentiment shift positively, ADA might find the support it needs to reverse its fortunes and begin an upward trajectory.
From a technical standpoint, ADA is now facing resistance at around $0.64. If the market provides enough support, ADA's price could once again test this level. On the downside, the support levels to watch are near $0.5946 which, if broken, could lead to further declines toward the stronger support zone at $0.5257, aligning with the 200-day moving average.


 Gamza Khanzadaev
 Arman Shirinyan
 Yuri Molchan
 Alex Dovbnya