Disclaimer: The opinions expressed by our writers are their own and do not represent the views of U.Today. The financial and market information provided on U.Today is intended for informational purposes only. U.Today is not liable for any financial losses incurred while trading cryptocurrencies. Conduct your own research by contacting financial experts before making any investment decisions. We believe that all content is accurate as of the date of publication, but certain offers mentioned may no longer be available.
After a promising climb, the price of Ethereum has failed to punch through the expected resistance level, leaving investors pondering its future trajectory. So, did Ethereum's recovery attempt falter? The charts suggest a pause.
A closer look at the price movement reveals ETH's resilience. After a steep climb to around $3,500, Ethereum seemed poised to break through and set new highs. However, it appears to have stumbled near the $3,491 mark.
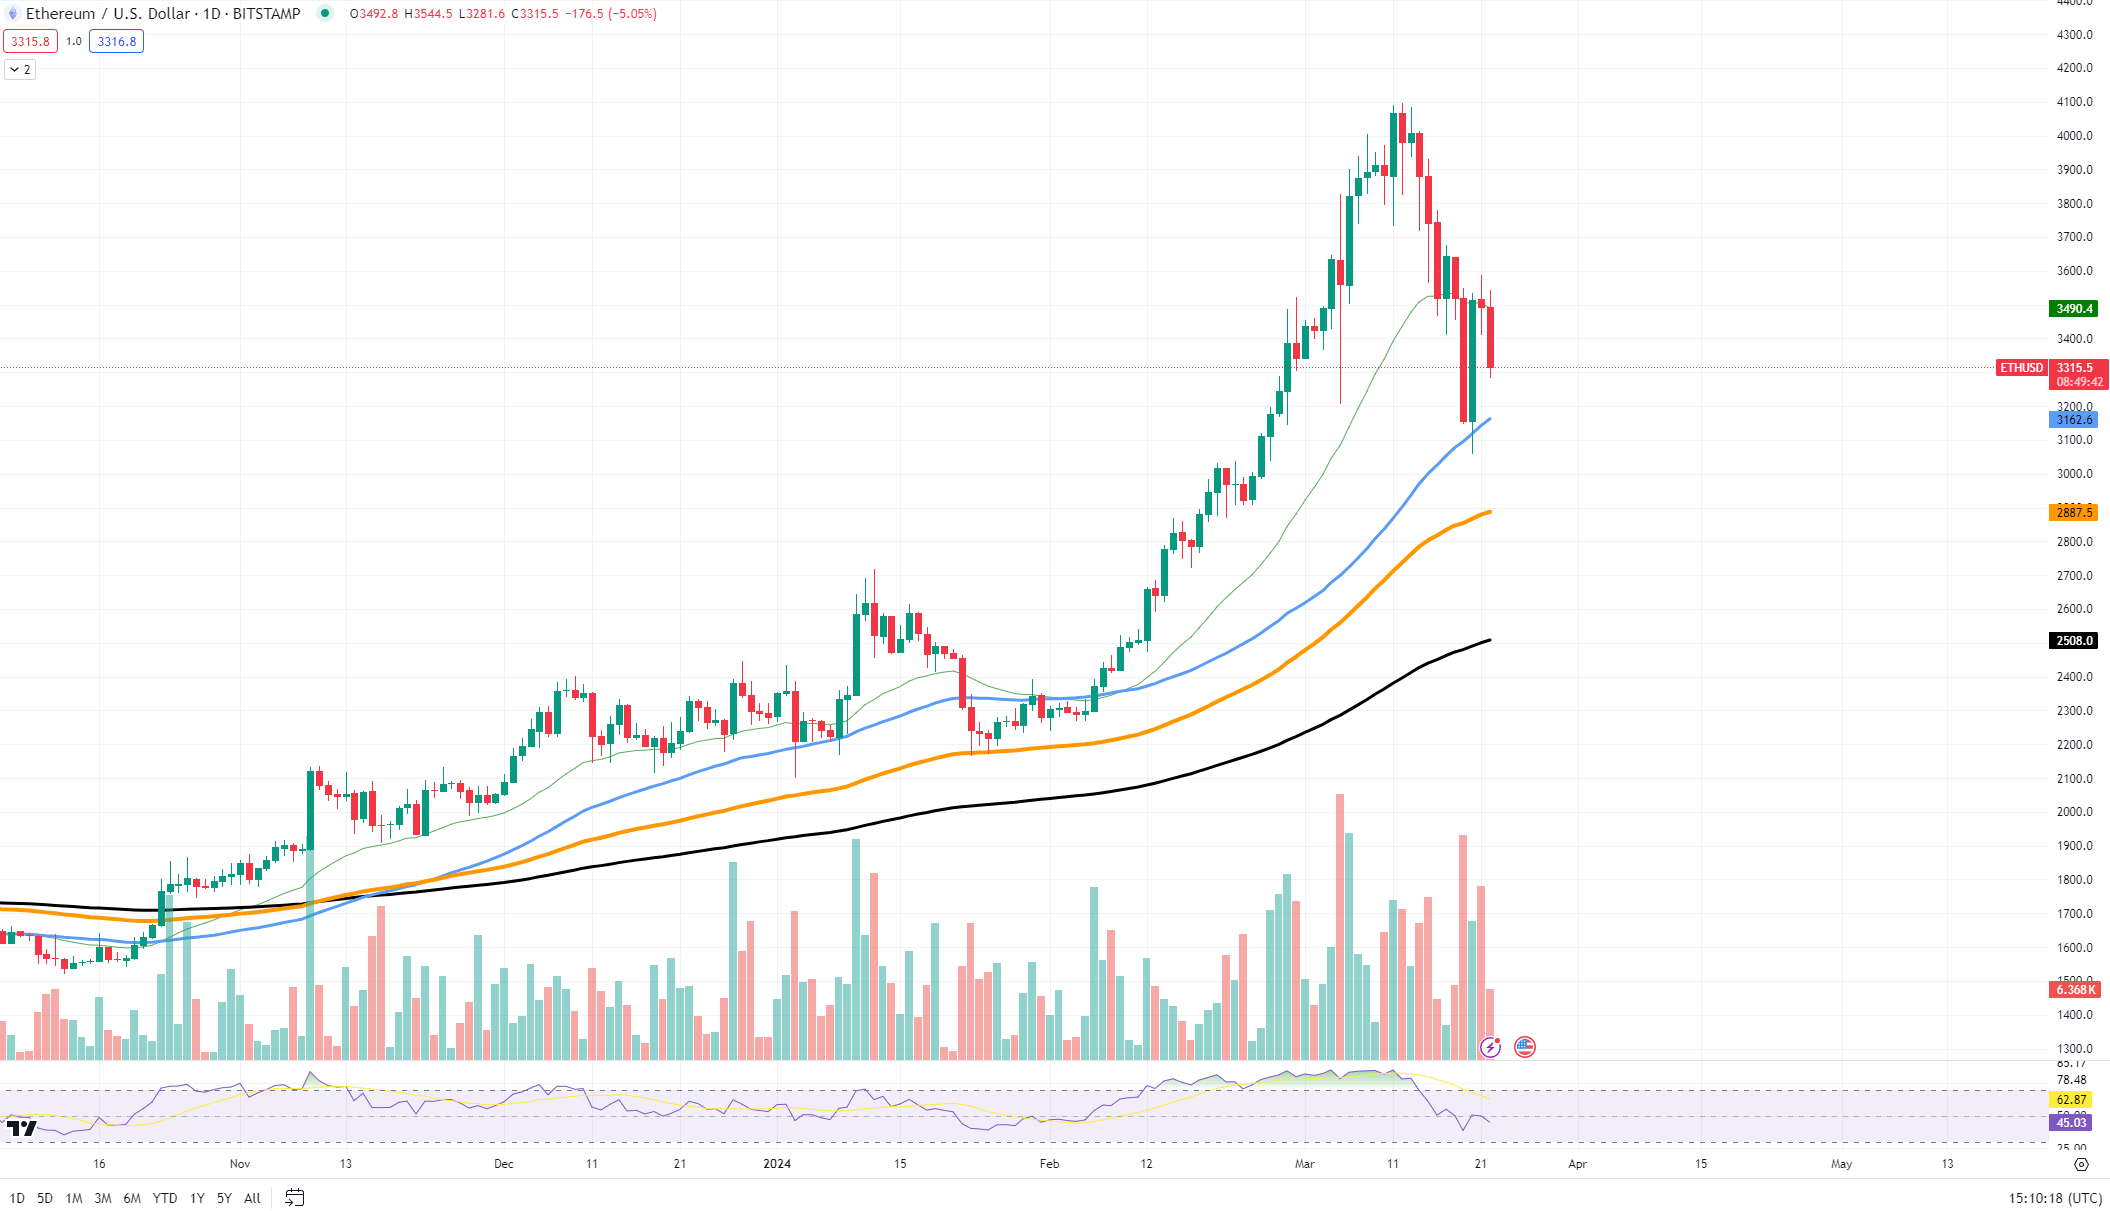
On the flip side, Ethereum's price has not dropped drastically either. It is hovering above the $3,317 support level, which is critical to keep recovery hopes alive.
If ETH holds steady and bounces back from the current support level, there could be another shot at breaking through the resistance. The next target in case of a breakthrough would be near the $3,900 zone. On the other hand, if the support fails, we might see the price dip toward the next support at around $2,869.
Despite the current pause, Ethereum's recovery has not failed; it is simply in a state of consolidation; soon we might expect a volatility surge and a corresponding move.
Cardano in good state
Cardano has almost reached a substantial support level, which could be the "adamantium" ground — a point so strong that the price has a hard time breaking below it — that it needs to bounce back up. ADA's price is getting close to the $0.54 mark, the go-to level to watch for now.
After a peak near $0.69, ADA has been on a slide. But it is approaching a price where, in the past, we have seen the trend reverse from falling to climbing. This is what some traders might call "adamantium" level.

If ADA holds above this support and starts to rise, we could be looking at a potential growth scenario. The first goal would be to tackle the immediate resistance level around $0.60. Climbing past this could put ADA in a better spot for growth, perhaps even reaching for higher levels like $0.67.
Solana's hidden potential
The charts give us a clue about where it might head next. There is a pattern where SOL is not making new highs or lows; it is sort of moving sideways. This could mean it is gearing up to keep going with the trend it was already on.
Right now, SOL is trading around $169.27. It had shot up past $200 not long ago but could not stay there. Now, if you are looking for where SOL might find a floor to bounce off from, keep an eye on the $129.35 mark. That has been a place in the past where the price has not gone much lower. It is like a strong line of defense.
As for growth, if SOL can get the wind back in its sails and start climbing, the first big test will be breaking past the $200 level again. That is where it struggled before. If it can go beyond that, it might just set off on another rally.
But what's next for SOL? If it stays above the support level and the market's feeling good, we might see it take another shot at going up. However, if it breaks down below that $129.35 level, it might have to find a new bottom before trying again.
So, what's the hidden signal in SOL’s price chart? It is this: the trend might just keep going. Since SOL is not making big jumps or drops, it is likely to stick with the path it has been on. That means more sideways movement until it either breaks out or down.
 Dan Burgin