
Disclaimer: The opinions expressed by our writers are their own and do not represent the views of U.Today. The financial and market information provided on U.Today is intended for informational purposes only. U.Today is not liable for any financial losses incurred while trading cryptocurrencies. Conduct your own research by contacting financial experts before making any investment decisions. We believe that all content is accurate as of the date of publication, but certain offers mentioned may no longer be available.
As it gets closer to $55,000 the price of Bitcoin is still showing signs of weakness, and a decline to $52,000 is looking more and more likely. A bearish attitude has been evident in recent market data, especially among institutional investors, who have been withdrawing their money from exchange-traded funds related to Bitcoin.
Sept. 5, 2017, saw $211 million in net withdrawals from Bitcoin spot ETFs the seventh day in a row of outflows. Notable ETFs saw withdrawals of $23.2 million from Grayscale's GBTC ETF and a significant $149 million loss from Fidelity's FBTC ETF. Bitwise's BITB ETF saw a $30 million withdrawal following the same pattern.
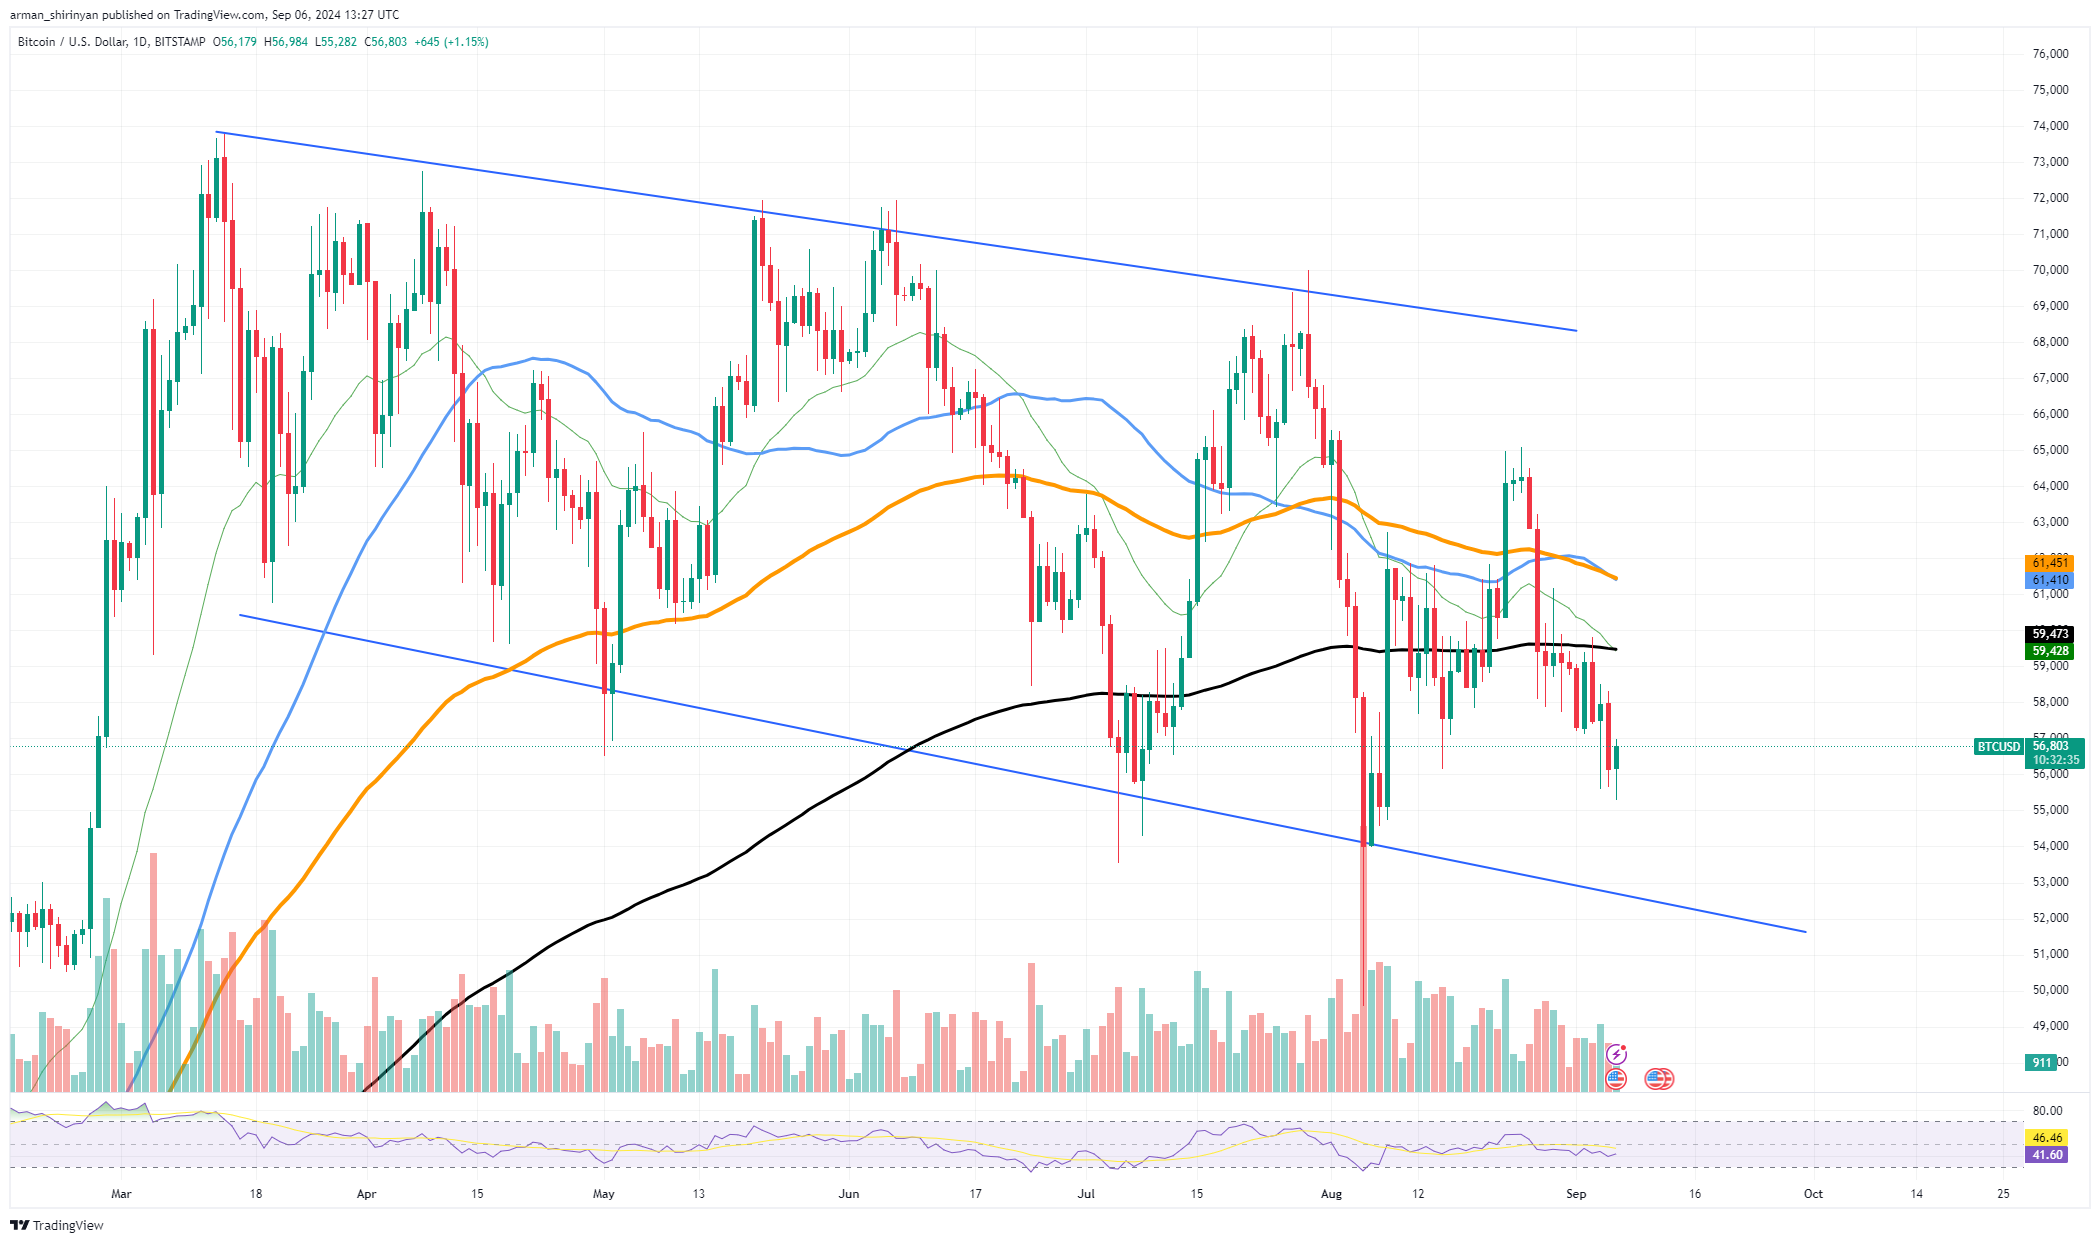
As a result, the market's declining institutional interest is reflected in the total net asset value of Bitcoin spot ETFs, which currently stands at $50.7 billion. The asset is presently trading below its 200 EMA, indicating a medium- to long-term bearish trend, according to the price chart of Bitcoin.
The price is currently within a declining price channel, and this downward trajectory is anticipated to continue unless there is a notable change in market sentiment. The amount of $52,000, which is at the bottom of the declining channel, is the next important level to keep an eye on. An even more marked sell-off may occur if the price breaks this level and keeps falling.
The bearish view is further supported by decreasing volume, which indicates that bulls do not have enough strength to drive the price higher at this point. A dearth of supportive market catalysts and institutional outflows seem to be the primary causes of the immediate selling pressure seen on Bitcoin. On the horizon, $52,000 is a critical level to keep an eye on. Investors should brace themselves for additional declines.
Shiba Inu still sleeping
The Shiba Inu market is still showing signs of stagnation, moving in a narrow sideways range that indicates the present lack of interest from sellers as well as buyers. The lack of substantial movement in either direction supports the idea that investors are mainly ignoring the asset in favor of other opportunities.
It is clear from examining the provided chart that SHIB is trading in an extremely narrow range and has not made any significant price movements. Typically volatility is a crucial sign of market activity, and its absence indicates that SHIB is having trouble creating any excitement.

Relative to the 10% threshold, there has been no movement, which suggests that institutional and retail investors are apathetic. A further impediment to any upward momentum is the technical position of SHIB's price, which is stuck below the important moving averages. It is difficult for the asset to stage any significant recovery because of the 50, 100 and 200-day EMAs' strong resistance levels.
The narrative that few traders are currently interacting with the asset is supported by the low volume that persists. Due to the lack of short-term profit opportunities presented by the price action, SHIB holders probably feel as though they are in an eternal sleep during this inactive period. SHIB looks to have been left out and left in a state of uncertainty, even though the overall cryptocurrency market may be volatile.
XRP falls out
The 200-day moving average, which is regarded as a key indicator of market direction, has been broken by XRP, indicating a sell-off. This decline beneath such a significant level suggests a more pessimistic outlook for cryptocurrencies, suggesting that XRP may see more short-term declines.
The price of XRP is struggling to maintain any momentum as it breaks below a number of important moving averages, including the 50 and 100-day EMAs, and the 200-day EMA is now serving as resistance, according to the provided chart analysis. It is a sign of diminishing buying interest and growing selling pressure that XRP was unable to maintain the $0.55 level.

Although not to the point where it would cause a significant reversal, the relative strength index of 39 indicates that XRP is approaching oversold territory. The notion that buyers are reluctant to intervene and offer support for a recovery is further supported by the low trading volume, indicating that bears are currently in control of market sentiment.
The recent problems witnessed by the cryptocurrency market as a whole are reflected in XRP's collapse in the larger market situation. Along with a general decline in all assets, institutional investor withdrawals from Bitcoin have also indicated weakness.
These more general market dynamics have probably had an impact on XRP's recent price action. As there does not seem to be a clear catalyst to break the trend, XRP's path of least resistance seems to be further downward.
 Dan Burgin
 U.Today Editorial Team