
*** Please note the analysis below is not investment advice. The views and opinions expressed here are solely those of the author and do not necessarily reflect the views of U.Today. Every investment and trading move involves risk, you should conduct your own research when making a decision.
Bitcoin price forecast
The Weekly chart
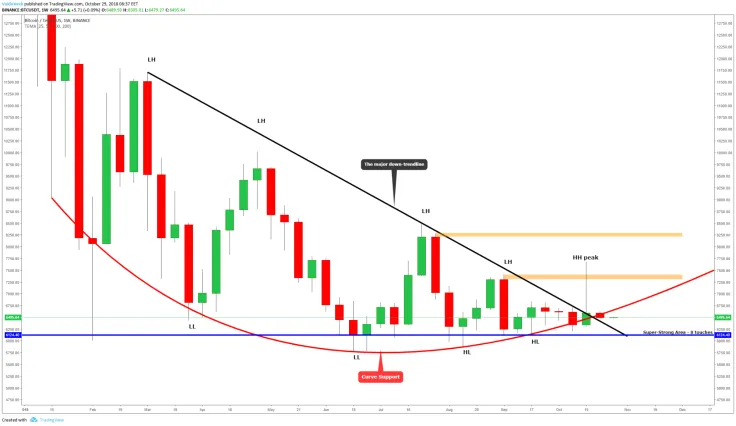
On the weekly chart, we can see that all the higher highs and higher lows are on the same place because of the very low price range movement. Last week, Bitcoin price moved in the $180 range: the highest price was $6,638, the lowest one was $6,453. From the price action perspective, there were some bullish momentums and bullish patterns, but the price just didn’t gain enough volume to make big moves. The best thing that we can read out from the weekly chart is that we are still above the major down-trendline which should work as a support.
The daily chart
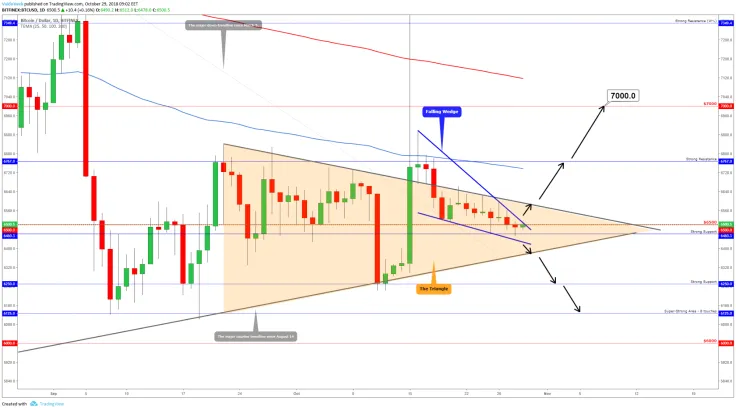
Let’s take a look at the current price action on the daily chart. We have two chart patterns, bullish candlestick patterns, at important levels. The chart patterns are the Triangle and the Falling Wedge, a continuation pattern.
The Triangle has been pulled from the trendlines. The bottom trendline is the major counter trendline which is pulled from the Aug. 14 low point, and the upper minor trendline is pulled from Sept. 22. Currently, the price is sitting exactly between those lines, and as you know, the Triangle has two breakout opportunities. So, in order to find out the short-term direction, we need to wait for a breakout from the Triangle.
Now, the second chart pattern — the Falling Wedge. As it is a continuation pattern and currently, the short-term trend is upwards, the continuation pattern works better if we see a breakout above the upper blue trendline.
We are very close to making a breakout, but the area is also very strong. At the moment, the upper blue trendline and the round number $6,500 make a crossing area, but we have a bullish indication that this may succeed because of the yesterday’s bullish candlestick pattern “Hammer.” It would be an important momentum sign, but lately, those “Hammers” didn't work as they should. Today is definitely an important day, and actually, the whole week is important to get to know about the further Bitcoin direction. We could see the price shake off again, which means a quick bounce upwards and a quick bounce downwards. Get ready: the BTC price can make any moves, but we want to search for some confirmations from the price movements.
Bullish confirmations:
- A daily candle close again above the round number $6,500.
- A daily candle close above the continuation pattern Falling Wedge, it will show short-term movement upwards.
- A daily candle close above the Triangle upper trendline.
If we manage to get those confirmations, we are heading into the major resistance area which is $6,767. There we could see the price stop again, and if we manage to break this as well, the major target would be $7,000.
Bearish confirmations:
- A daily candle close below the strong support at $6,460.
- Daily candle close below the Falling Wedge chart pattern.
- Daily candle close below the Triangle.
If you see those breakouts downwards, be very cautious because then we could go and hit the new 2018 lows.
Ripple price forecast
The Weekly chart
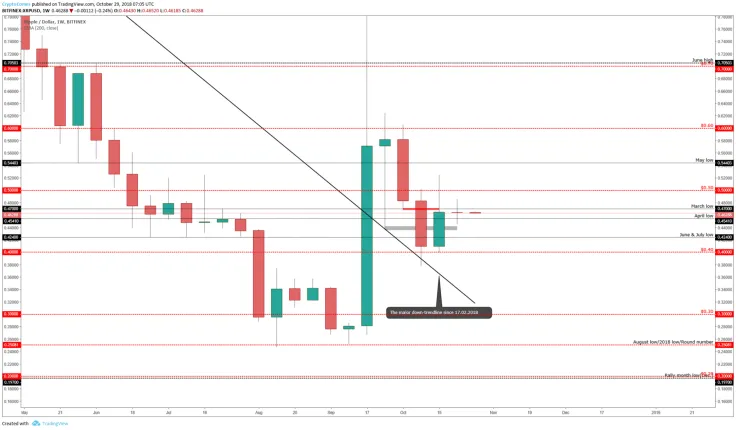
Like almost the whole market, Ripple also had a low volume week. The price range was between $0.44 to $0.485. Technically, it is in the good area if we want to see higher prices, but as always, all depends on Bitcoin and the market. Currently, the price trades between April and March low. But let’s look at the smaller time frame: there are pretty nice and clean chart patterns.
The daily chart
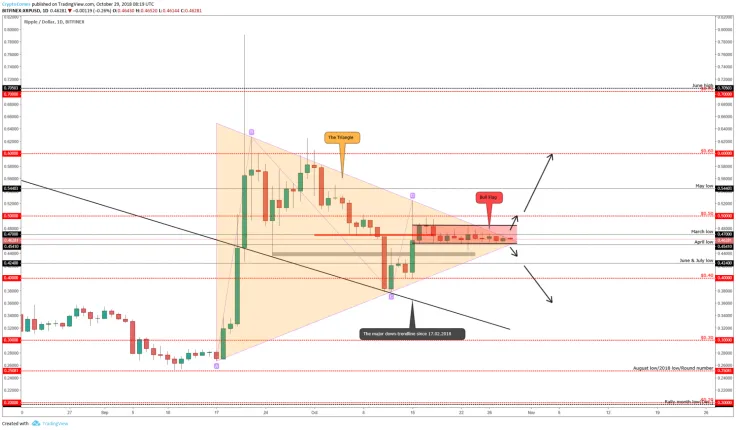
If we look at the daily chart, there are several bullish signs: some chart patterns and some pretty good price levels which work strongly as resistances and supports.
Let’s start with the chart patterns.
There is a Triangle and a continuation pattern called the Bull Flag. The Triangle is the easiest pattern to trade: if you see a breakout in either direction, this could be the next possible way the price is heading to. A breakout would be confirmed if you see at least a four-hour candle above or below the Triangle; a full confirmation comes from the daily candle close. Currently, we are on the Triangle tip, and if you have invested in the Ripple, pay attention because we could see a high volume.
Now the continuation pattern, the Bull Flag. Currently, the short-term trend is positive, and it confirms that bullish momentum may come after the breakout upwards from the mentioned pattern. The massive confirmation would be a candle close above the Bull Flag upper resistance line and above the Triangle trendline. In this case, we have two bullish confirmations and should be ready to climb to higher levels.
Let’s try to forecast the weekly bullish scenario:
- We have to break above the Bull Flag, the price has been in this Flag for more than 14 days now, and a breakout could trigger the volume.
- At least the daily or the four-hour candle has to close above the Triangle and above the March low level at $0.47.
After those confirmations, the round number resistance $0.5 and the 200 EMA crossing area come. We could assume that after those low volume weeks, this resistance is easy to break if we see a volume inside the shorter time frame candles, and a break above the $0.5 will guide us easily to around the $0.6.
Bearish scenario:
- A candle close below the Bull Flag.
- A candle close below the Triangle.
- A candle close below the April low at $0.454.
This scenario could be pretty ugly because we could go and hit the new short-term lower low below $0.4. Overall, a daily candle close below the April low level with a high volume inside of it will confirm bearishness. Our recommendation is to stay away from the Ripple if this happens.
Cardano price forecast
If Ripple didn’t lose any value last week, Cardano suffered a five-percent loss.
Cardano starts to show us some bearish signs, and we are very close to getting some bearish confirmations.
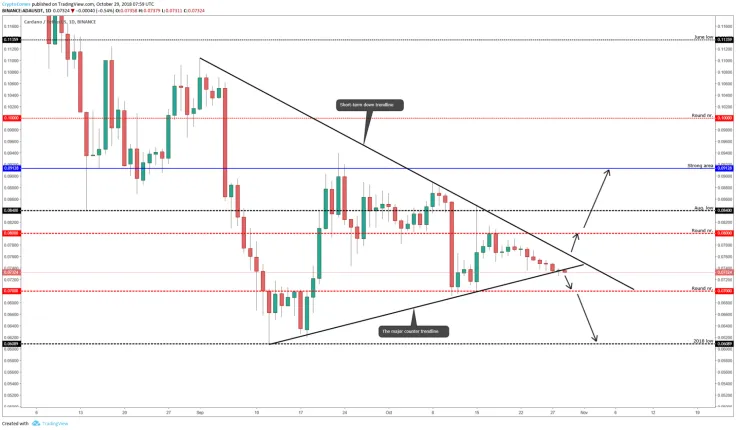
Currently, we have two trendlines: a short-term down trendline which is pulled from Sept. 1, a high point, and the major counter trendline which is pulled from Sept. 12, a low point. This major counter trendline starts to give us some bearish signs.
On Sunday, the price was below the counter trendline, but luckily, it managed to jump back above the trendline and now tries to break below the counter trendline again. The close below the line will confirm bearishness because of the overall trend. The overall trend is down, and if the counter trendline — you can also call this a short-term up-trendline — breaks, it will indicate that the current up-trend momentum has gone and we may continue to the overall direction which is downwards.
This bearish scenario is definitely on the table if Bitcoin can’t break above the Falling Wedge chart pattern and if it doesn’t get a close above that. A rejection downwards will pull down the whole market, and as you can see on the price action, it definitely pulls Cardano down.
Bullish confirmations:
- First of all, we have to get back into the Triangle.
- A daily candle close above the short-term down trendline. It will guide us to the round number at $0.8.
- A candle close above the $0.8 will guide us to the strong area which is at $0.91.
Bearish confirmations:
- A daily candle close below the counter trendline will guide us to the round number area at $0.7.
- A daily candle close below the round number, which historically worked as a support level, will trigger the bear market for Cardano. There are now significant support levels; so, a close below the $0.7 will guide us to the 2018 low levels.
 U.Today Editorial Team
 Dan Burgin