Bitcoin continues rocking the market with altcoins following its path. We have reached the $5,000 level successfully and even witnessed BTC going up to $5,100. So, what’s next? Let TradingView users share their opinions and Bitcoin price predictions. They will explain how to trade Bitcoin in current market conditions, and what to expect from the world’s most popular cryptocurrency in both the short and long term.
Looks like breakdown from $6,000 in opposite direction
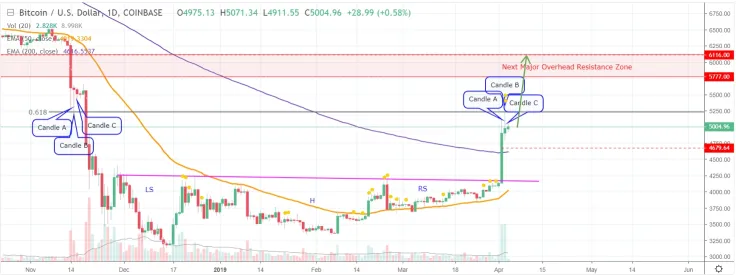
Bitcoin price chart from MagicPoopCannon
Looking at the breakdown from $6,000, we can see that there was a sharp drop, and then consolidation. The first three candles are marked as "Candle A," "Candle B," and "Candle C." As you can see, candle A was huge and had a long lower wick. Then, candle B formed an even lower wick, but in the form of a hammer candle. Candle C then resumed the sideways consolidation pattern.
Looking at the current price action, we can see that it is pretty much the exact same thing so far, just in the opposite direction. Candle A is huge, and it has a long upper wick, similar to the long lower wick on the red A candle. Then, candle B produced an even taller wick, and it closed in the form of a hammer, just like the first B candle. Now, the current C candle appears to be continuing with the sideways consolidation. So, this is very similar to what we saw on the breakdown from $6,000. So, if the price maintains these similarities, we could see another explosive rise that catapults Bitcoin into the major overhead resistance zone.
Wait and hodl: We target $6,000-6,300
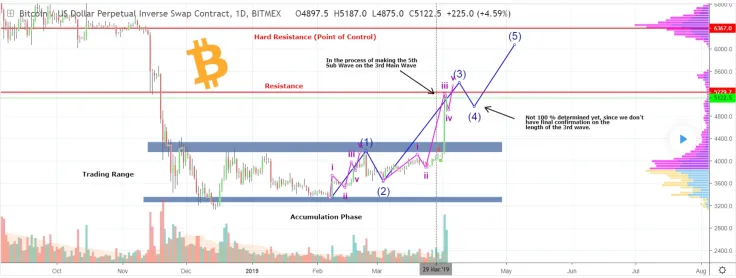
Bitcoin price chart from D4rkEnergY
According to D4rkEnergY, since February 5th, we have been through an accumulation phase. Now, the bullish market has restored. However, the user’s recommendation now is to wait because we will soon retrace a bit (4th wave). And then, we will go up again. Our target is between the 2 red lines – most likely $6,000-6,300. This summer promises to be hot.
At the moment, we’re observing a struggle in Bitcoin’s price path. The 5th Sub-Wave is having a hard time with the red resistance line, and therefore we might see it be truncated. Thereafter we will retrace on wave 4.
True Bitcoin bottom is months away
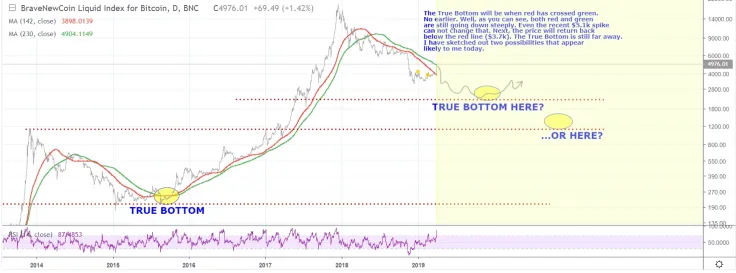
Bitcoin price chart from ReallyMe
According to ReallyMe, the breakout is only a short-term phenomenon. We will soon be ironed out again, but it’s actually not so scary. So, what to expect?
The true bottom will be when red has crossed green, not earlier. As you can see, both red and green are still going down steeply. Even the recent $5.1k spike could not change that.
Next, the price will return back below the red line ($3,700). The true bottom is still far away. On the price graph, you can see two possibilities that appear likely to the user.
Sell your house, to the moon!
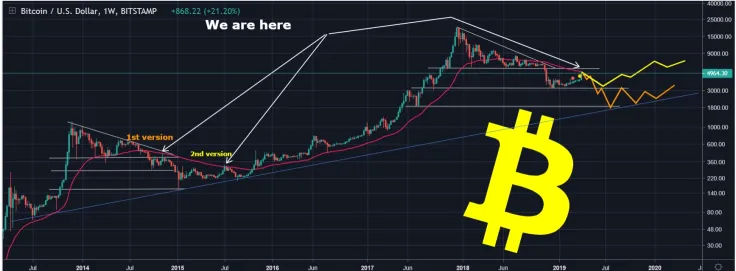
Bitcoin price chart from AIMORAN
So, how to trade Bitcoin in the current conditions? Let user AIMORAN explain.
-
We now have two scenarios, the first more bloody with a fall to $1,800-2,000. It will be activated at the close of the week and in the case of pinbar formation.
-
The second scenario will be activated if the weekly candle does not close with a large shadow and then we will only have a correction to the level of $3,600.
In any case, do not have FOMO, as such manipulations have already occurred a dozen times since the beginning of 2018.
We will open a short this week, but today it is early and dangerous to do it! Most likely there will be a pump to the level of $5,600-5,800, and then the manipulators will take profits and the weekly candlestick will close with a big shadow, so, for now, the level for the shorts is $5,600-5,800!
Great opportunity for shorts. We expect the week to close, if MA 200 buyers do not break out, we will open a short.
Bitcoin’s recent price growth opens a lot of trading possibilities. While we target $6,000, don’t forget that BTC is expected to fall again after that. Slowly but steadily, we’re moving towards a very hot summer.
 Denys Serhiichuk
 Godfrey Benjamin
 Tomiwabold Olajide
 Dan Burgin