*** Please note the analysis below is not investment advice. The views and opinions expressed here are solely those of the author and do not necessarily reflect the views of U.Today. Every investment and trading move involves risk, you should conduct your own research when making a decision.
Bitcoin fights historically strong resistance
Over the weekend, the Bitcoin price showed us a very steady grind upwards and because of it, there was a steady growth on the altcoins list.
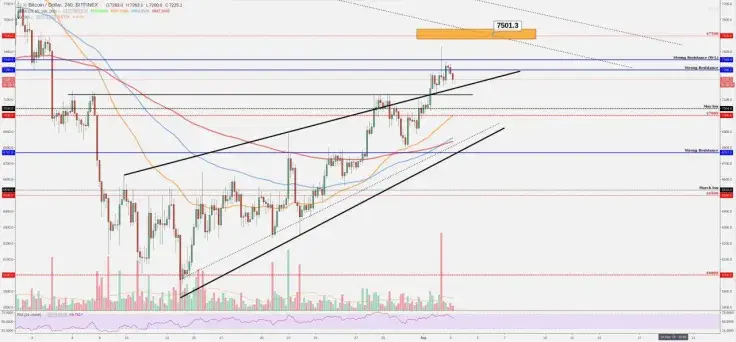
Currently, the BTC chart shows us that we are on the strong resistance area which is $7,286-$7,349. From here we expect a little pullback or the price stop just a while and if we break this area then our short-term target would be around $7,500.
$7,500 target criteria:
* Fibonacci pulled from July 24-Aug.14
* Round number
* Trendline since May 5
* Fibonacci extensions (entry point Fibonacci's)
* Round number and Fibonacci retracement level are just SO identical.

Let's talk a little bit about the current pullback. At the moment the price is above the minor trendline which is pulled from the wicks. It makes for us an upward channel, the price may go inside this channel and the first bigger retest area is around $7,000.
There we can find a May low which works as a support, round number and in the four-hour chart, we could see that the 50 EMA starts to work as a support. If it drops lower, then our next support is around $6767 which is historically worked level and there is also our last trendline. This has to hold us, if not then we go definitely test the lower levels.
Ethereum still in symmetric triangle
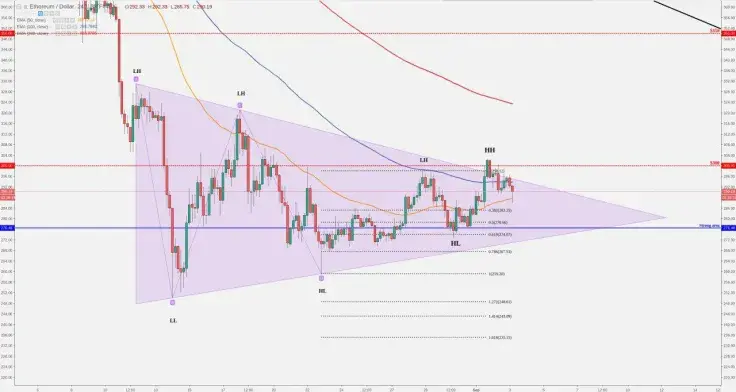
The current situation on the ETH chart shows us that, after the bounce upwards from our mentioned level, we tried to break outside the triangle and tried to break the round number $300 but this attempt was unsuccessful. ETH price was very close to make a breakout but we didn't find much power to hold the price above the $300.

Luckily, we had something positive on the ETH chart- ETH price structure made a small higher high which indicate that we are still on the rising mode and now the pullback definitely have to hold us over the blue support line if we want to stay bullish (marked as Strong Area). We know that soon we will see some bigger action on the Ethereum chart because we are on the triangle tip where the price is 'pushed ' together and soon it will launch. At the moment definitely don't trade this and wait for a breakout from the triangle. Breakout from triangle means short-term Ethereum direction and breakout is confirmed when we have at least a four-hour candle outside that area.
Ripple (XRP) takes down the minor downtrend line
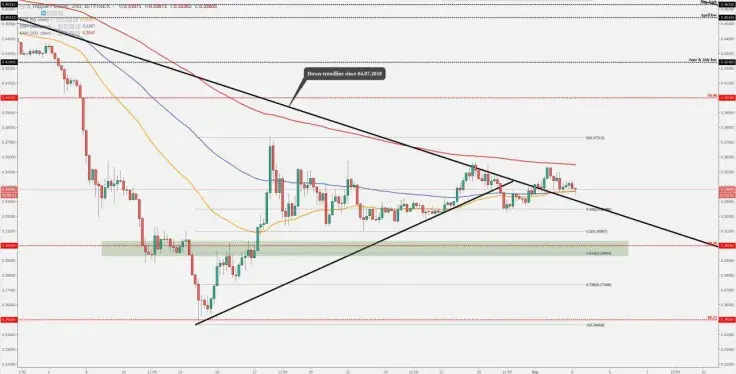
If we take a look Ripple chart, then we could see that over the weekend we managed to break above the minor down-trendline since July 4, 2018 and currently we make pullback to retest the trendline. It could mean that if the market starts to show us some potential to go higher then Ripple have a nice starting platform to do exactly the same.

Currently, on the four-hour chart, Ripple price has found a support from 50 and 100 EMA's. The perfect scenario would be a retest the trendline and our climb will continue (because the textbook says- buy/sell breakouts after the retest) but we can start to climb higher only then when BTC finds the support because if BTC drops and the market cap drops then we could see again 'bloody' days on the market.
If we start to go higher then basically our next resistance is a round number $0.4.
Hopefully, this helps you out a little bit to confirm your own analysis.
 Alex Dovbnya
 Dan Burgin
 Denys Serhiichuk
 Gamza Khanzadaev