Disclaimer: The opinions expressed by our writers are their own and do not represent the views of U.Today. The financial and market information provided on U.Today is intended for informational purposes only. U.Today is not liable for any financial losses incurred while trading cryptocurrencies. Conduct your own research by contacting financial experts before making any investment decisions. We believe that all content is accurate as of the date of publication, but certain offers mentioned may no longer be available.
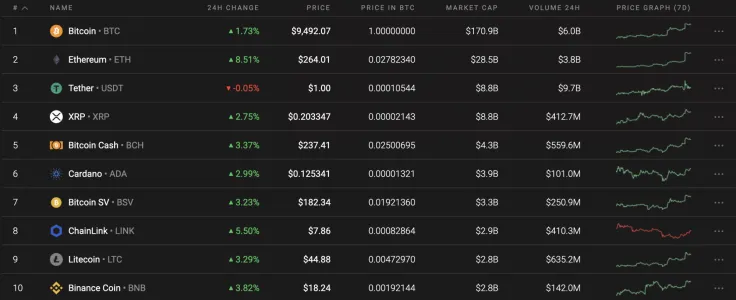
After yesterday's sharp move of Bitcoin (BTC), all of the top 10 coins remain in the bullish zone, while altcoins are outperforming the leading crypto in terms of growth.
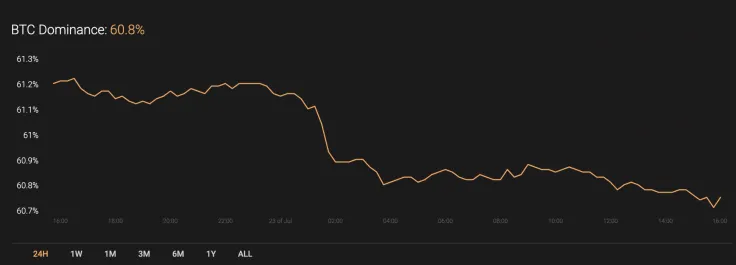
Meanwhile, the dominance rate of Bitcoin (BTC) is in the bearish zone, having broken the 61% index. At the moment, the market share of the leading crypto makes up 60.8%.
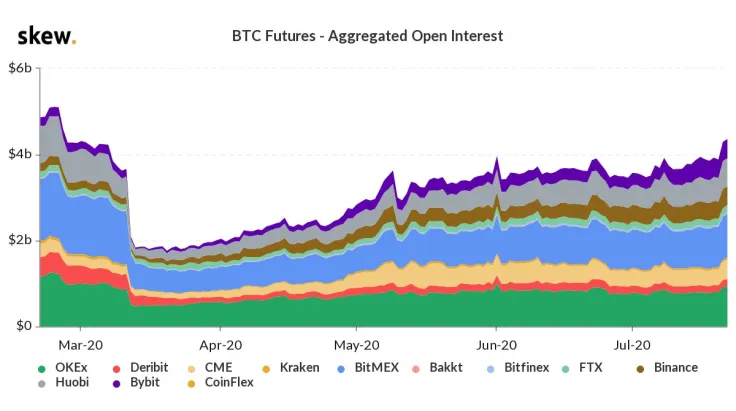
However, open interest on the cryptocurrency exchanges is going up, which is usually accompanied by a continued bull run.
Take a look at key data for Bitcoin today:
-
Name: Bitcoin
-
Ticker: BTC
-
Market Cap: $174,980,491,336
Advertisement -
Price: $9,489.10
-
Volume (24h): $17,190,370,768
-
Change (24h): 1.80%
The data is current at press time.
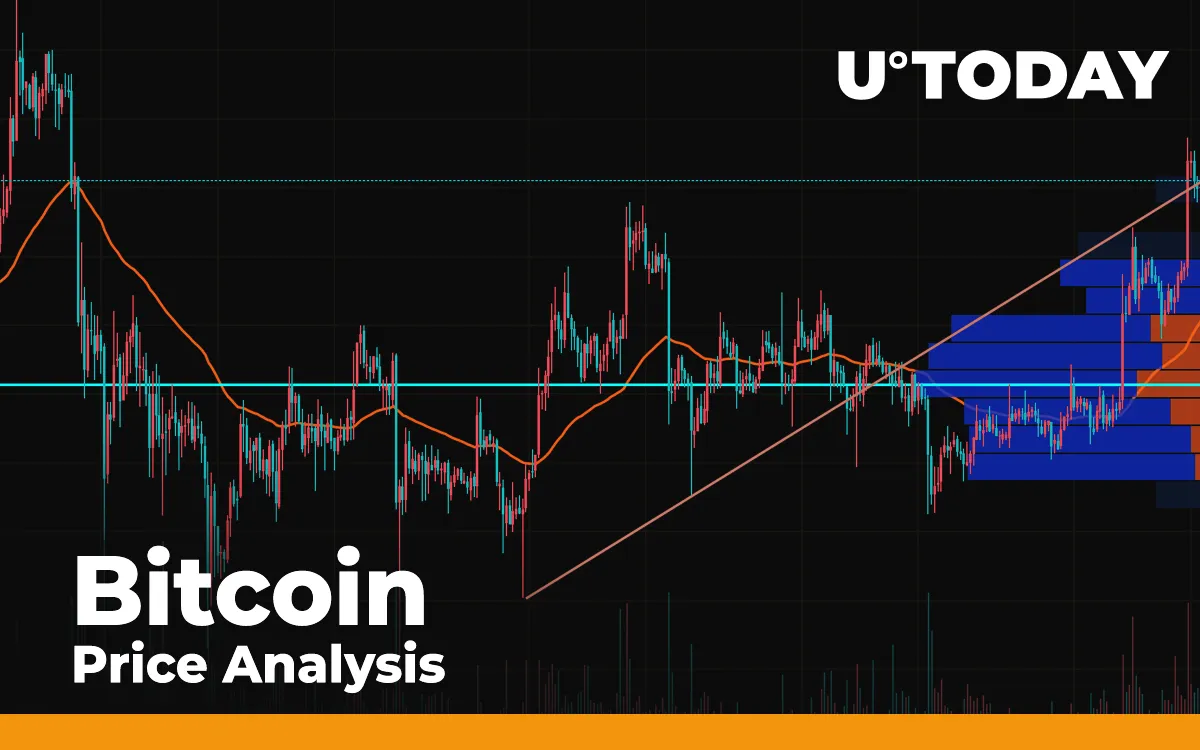
BTC/USD: Can bulls move to $9,700 or should we expect a slight decrease to $9,400?
Yesterday the $9,300 level acted as a support and stopped the pullback of the Bitcoin (BTC) price. The bulls seized the chance, gradually increasing buying volumes, and at the end of the day, a powerful bullish momentum broke through $9,441, testing the uptrend line.
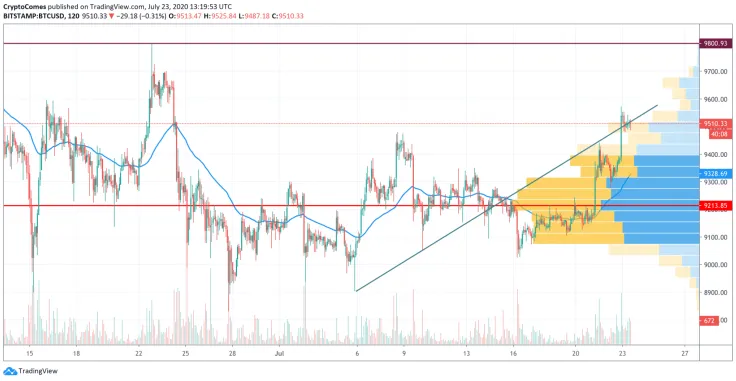
Bitcoin (BTC) managed to update the July high to $9,573, but this morning the price slipped to the area of $9,500. To continue the rally, the bulls need to gain a foothold above the rising trend line. If in the near future buyers overcome the resistance in the area of $9,600, then the race may continue to the level of $9,800. If bears try to increase the pressure, then one can count on a fairly strong support level of $9,441.
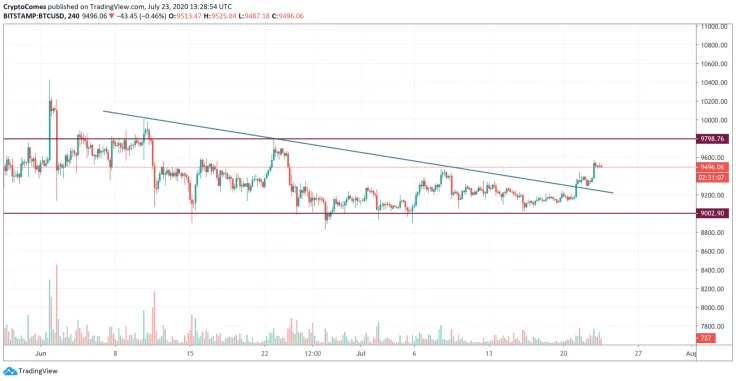
On July 21, Bitcoin (BTC) broke through the upper border of the descending Triangle after several unsuccessful attempts. From the point of view of technical analysis, this is a signal for a possible rise in price to $10,000. The price never reached the support level of $8,900. In other words, the slope resistance line was broken through without fuel in the form of pending buy orders at $8,900.
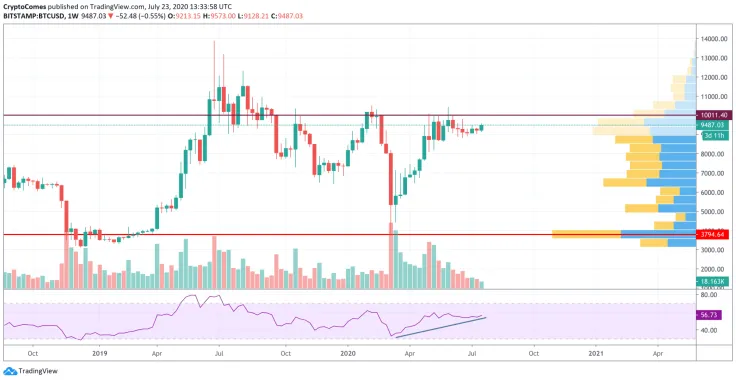
On the weekly chart, Bitcoin (BTC) is slightly turning to the bullish zone. However, trading volume is still too low to fix above $10,000. On the other hand, there is a bullish divergence on the RSI indicator, and it has not reached the overbought zone yet. In this case, traders may expect a false breakout of the $10,000 mark followed by a decline.
Bitcoin is trading at $9,495 at press time.
 Dan Burgin
 U.Today Editorial Team