Disclaimer: The opinions expressed by our writers are their own and do not represent the views of U.Today. The financial and market information provided on U.Today is intended for informational purposes only. U.Today is not liable for any financial losses incurred while trading cryptocurrencies. Conduct your own research by contacting financial experts before making any investment decisions. We believe that all content is accurate as of the date of publication, but certain offers mentioned may no longer be available.
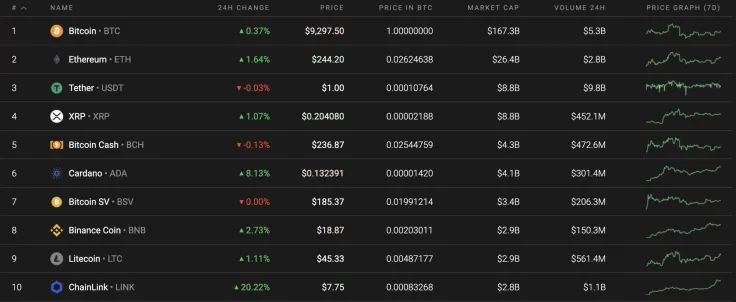
Even though the cryptocurrency market is in the green zone, the growth does not apply to all coins in the top 10 list. Importantly, Bitcoin Cash (BCH) has lost 0.13% over the past day.
In terms of the mood of the institutional players, they have increasingly taken long positions, according to the most recent report of July 7.

The relevant Bitcoin data is stacking up this way:
-
Name: Bitcoin
Advertisement -
Ticker: BTC
-
Market Cap: $171,255,794,423
-
Price: $9,291.35
Advertisement -
Volume (24h): $16,738,630,885
-
Change (24h): 0.60%
The data is current as of press time.
BTC/USD: Is there enough fuel to reach $9,400?
Yesterday morning, the price of Bitcoin (BTC) indicated a local minimum of $9,053 but rebounded to $9,150. During the day, the pair recovered and, by the end of the day, reached the average price level, which slowed growth.
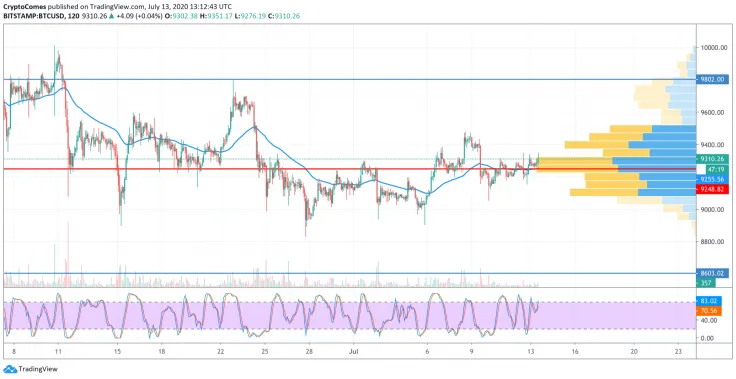
In the Asian session, it was not possible to significantly increase the volume of purchases, but buyers were able to overcome the two-hour EMA55 and test the resistance of $9,300. In the near future, this level of resistance might keep the pair in short-term consolidation. The lower limit of this range may be the level of the two-hour EMA55. If the activity of market participants remains at a low level, then the pair will stay flat on the POC indicator line until the end of the week.
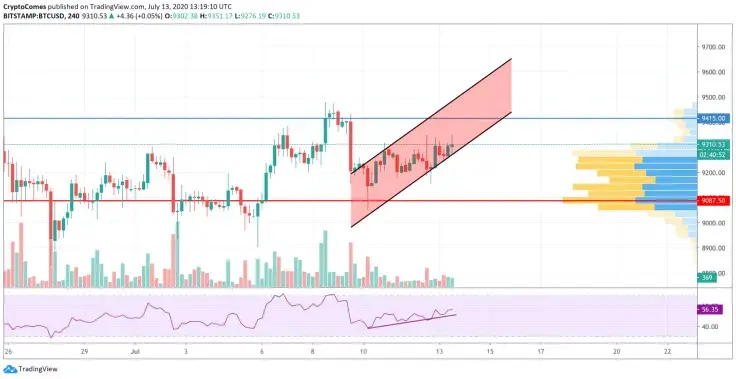
On the 4H chart, buyers did not allow Bitcoin (BTC) to retest at the $9,000 level of the weekend. The ongoing rise is accompanied by a moderate trading volume, which means that the asset still has growth potential. In addition, there is a bullish divergence on the RSI indicator that is also a positive signal for buyers. If Bitcoin (BTC) keeps following this scenario, local resistance at $9,415 will be attained shortly.
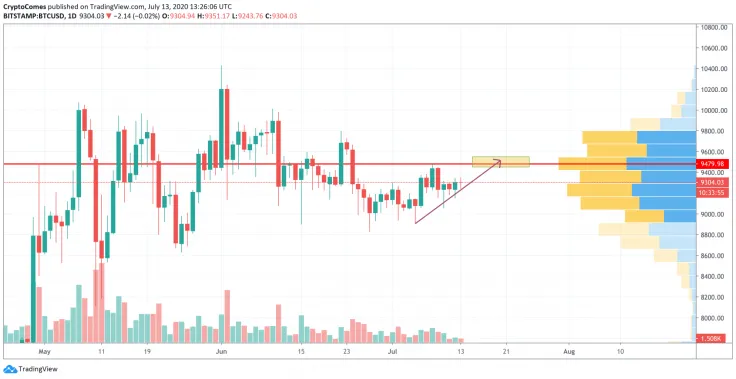
According to the daily time frame, ongoing growth might last until the leading crypto reaches the yellow range of $9,450-$9,550 as there is not enough volume for a further rise. Moreover, there is a large concentration of liquidity in that area. That is why sideways trading is the more likely option for the current week.
Bitcoin is trading at $9,304 at press time.
 Arman Shirinyan
 Alex Dovbnya
 Denys Serhiichuk