
Disclaimer: The opinions expressed by our writers are their own and do not represent the views of U.Today. The financial and market information provided on U.Today is intended for informational purposes only. U.Today is not liable for any financial losses incurred while trading cryptocurrencies. Conduct your own research by contacting financial experts before making any investment decisions. We believe that all content is accurate as of the date of publication, but certain offers mentioned may no longer be available.
Bitcoin's recent charts have been causing a buzz in the cryptocurrency community, but not for the usual bullish reasons. A closer look at the current trend reveals a bull flag pattern emerging on the BTC/USD chart, a formation that typically signals a continuation of the preceding upward trend. However, in the present context, this technical configuration might not bode well for Bitcoin bulls in the short term.
The bull flag pattern is identified by a sharp rise in price, forming the "flagpole," followed by a consolidative rectangle or a parallelogram that slopes against the trend. This pattern suggests that the market is taking a breath before attempting to continue the previous trend. However, this consolidation is happening amid a backdrop of concerning market dynamics, which could imply an imminent correction.
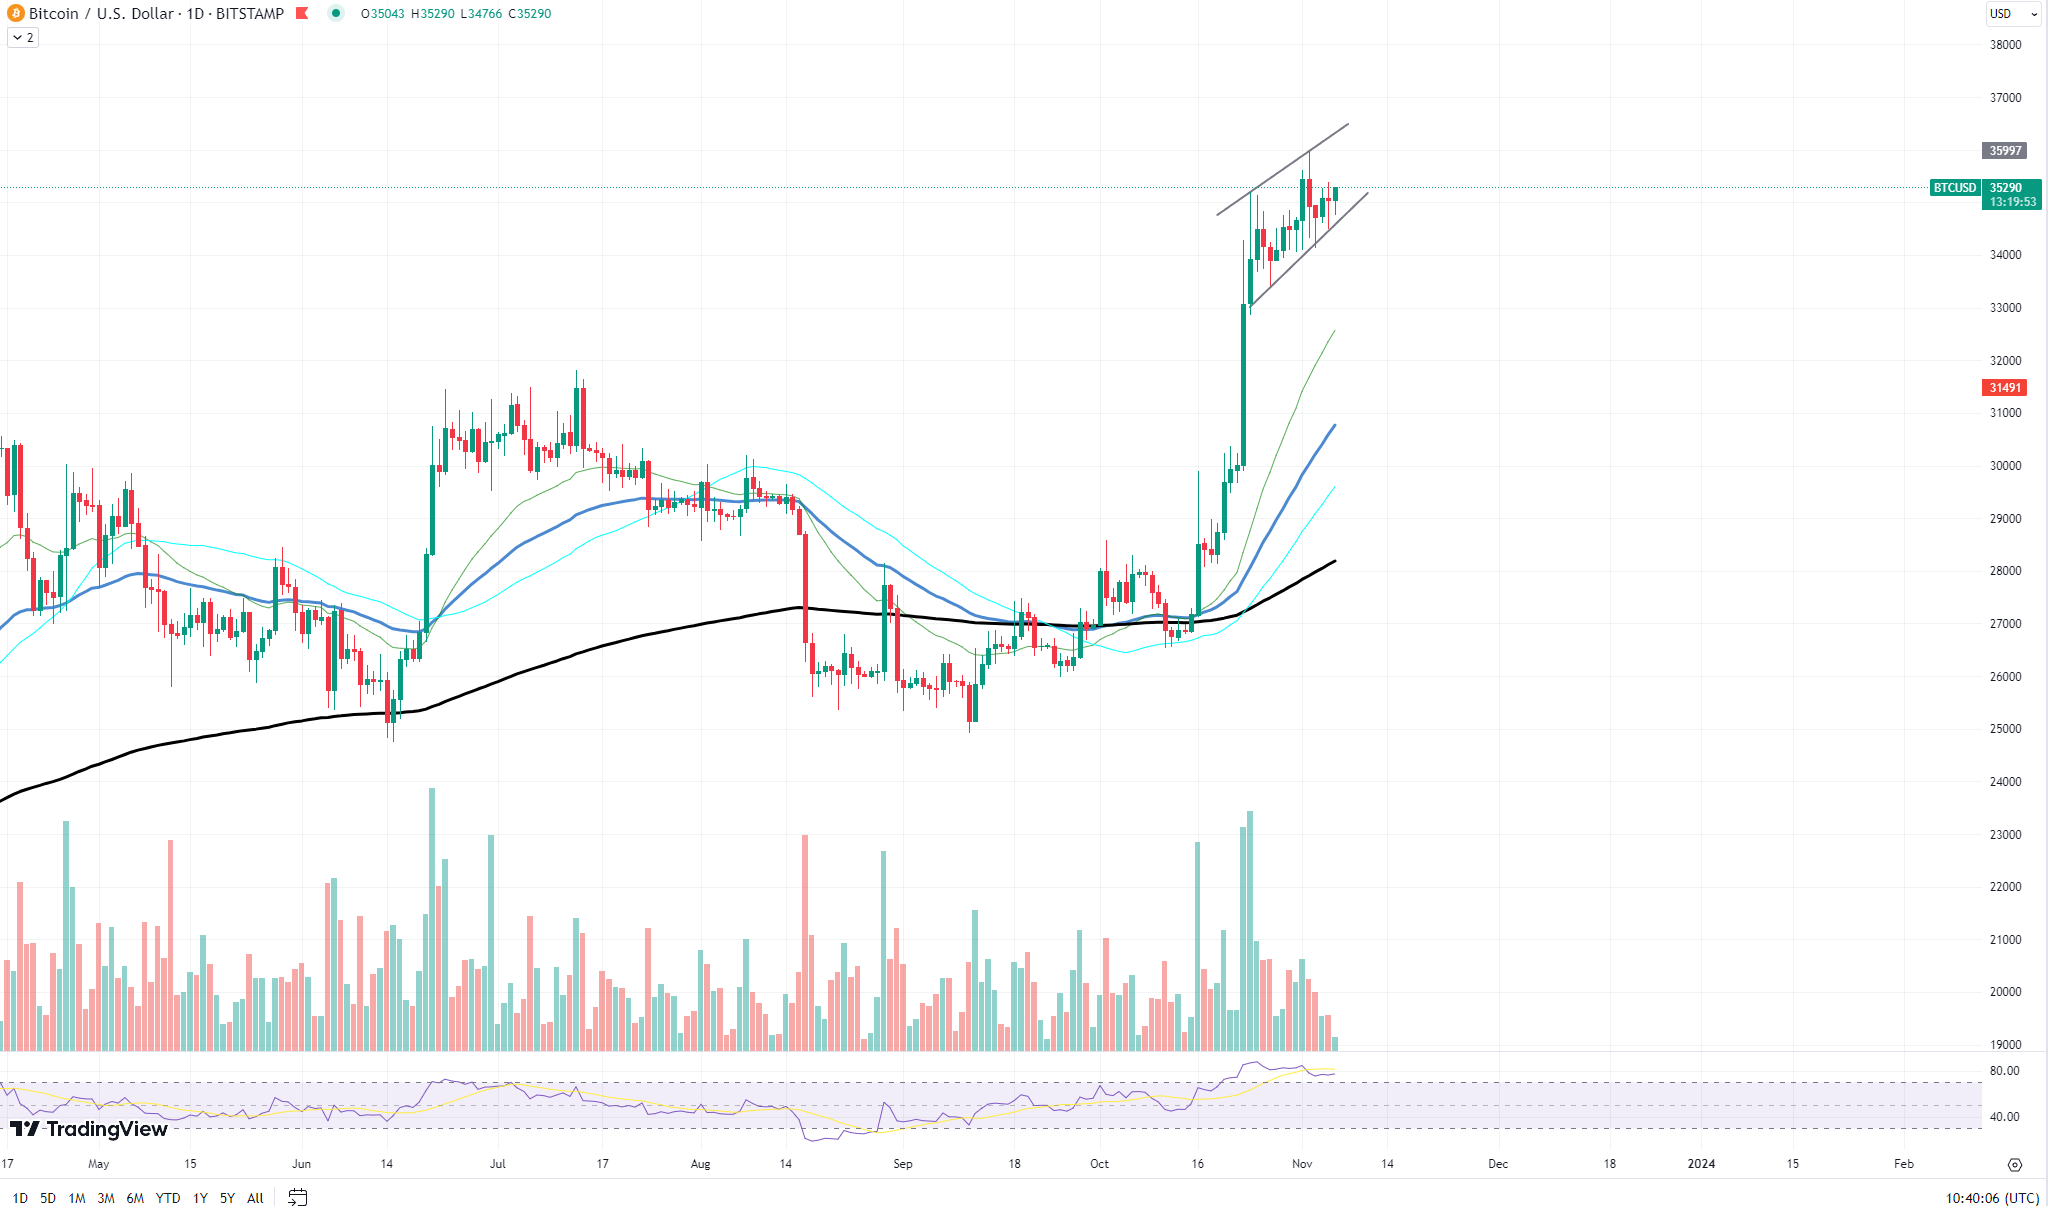
Performing a technical analysis by examining other indicators such as the Exponential Moving Averages (EMAs), the Relative Strength Index (RSI) and volume trends offers a more nuanced picture. The EMAs show that Bitcoin is still trading above the key moving averages, which typically would be a bullish signal. But with the EMAs beginning to level out, the momentum could be waning.

The RSI, a measure of whether an asset is overbought or oversold, is hovering near overbought territory. This suggests that Bitcoin's price might have risen too quickly, and a retracement could be due. The trading volume has been declining during the formation of the flag pattern, a sign that the upward movement creating the flagpole might not have strong conviction behind it.
For traders and investors looking at the short-term picture, this combination of a bull flag pattern with hesitant volume and an overbought RSI could point toward an impending pullback. Such a correction might weed out weak hands and could be healthy for the market, as it allows Bitcoin to reset before attempting another climb.
However, it is essential to consider Bitcoin's intrinsic label as "digital gold." Over the long term, the fundamental narrative around Bitcoin as a hedge against inflation and a store of value in the digital age remains strong. Short-term fluctuations, such as the potential correction hinted at by the current pattern, do not alter the long-term view many hold that Bitcoin could continue to appreciate over the years.
 Dan Burgin
 U.Today Editorial Team