*** Please note, the analysis below is not an investment advice. The views and opinions expressed here are solely those of the author and do not necessarily reflect the views of U.Today. Every investment and trading move involves risk, you should conduct your own research when making a decision.
Over a long time, we can pick up some positive signs from the cryptocurrency market and so as our next analysis- Bitcoin (BTC) & Cardano ( ADA ).
We have been on the down-train, yes train, for a very long time but at the moment looks like we have some changes in the market structure.
Let’s start with Bitcoin
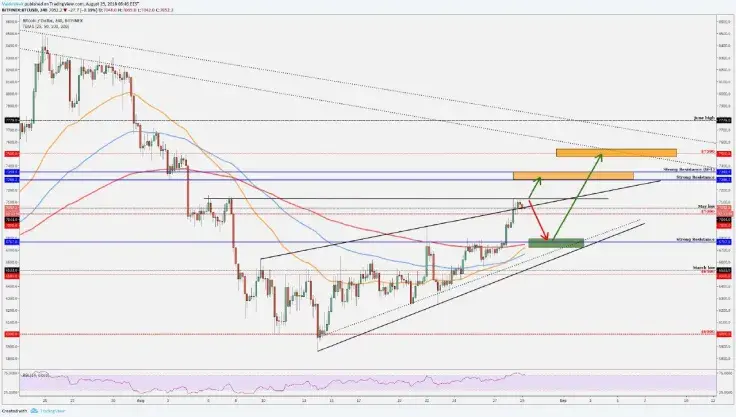
At the moment I would like to share some higher resistance areas if somebody doesn't know where to take out some profits if we fly higher, and one technically good entry point if we start to make a pullback!
From my point of view, the first strong resistance is around $7,286-$7,349. Historically, this level is worked nicely and if somebody is on the trade then this level is definitely one point where you must consider to take out some partial profit. If we rally through this level right away then the second one is $7,500 (described later in the post)!
If you are not in the trade at the moment then definitely do not enter before we make a pullback or before we haven't got any significant confirmation, because the current price is very risky and full of FOMO, it may fall down quickly!
The pullback may happen because we are on the trendline which is pulled wick to wick(first touch Aug. 8 and the second touch Aug. 22) and we are on the decent resistance zone (we have the May low and a round number $7,000)
Where we can enter the trade after the pullback!?

From the current price perspective (current price is $7,052), the ideal entry point would be around $6,700-$6,800.
Entry point criteria:
1. We have historically a strong resistance which now becomes a support at $6,766
2. Fibonacci I- pulled from Aug. 8-28 retracement 38 percent
3. Fibonacci II- pulled from Aug. 26-28 retracement 62 percent
4. Close to upwards trendline- pulled from bodies since Aug. 14
5. Supported with 50 daily EMA
6. Supported with multiple EMA's on the 4h chart
7. Definitely, we wait and watch the current price action in this area if we reach there
Target $7,500 criteria (for those who are in the trade at the moment and for those who enter a trade after the pullback):
1. Fibonacci pulled from July 24- Aug. 14
2. Round number
3. Trendline since May 5th
4. Fibonacci extensions (entry point Fibonacci's)
5. Round number and Fibonacci retracement level are just SO identical!
Cardano (ADA/USDT)
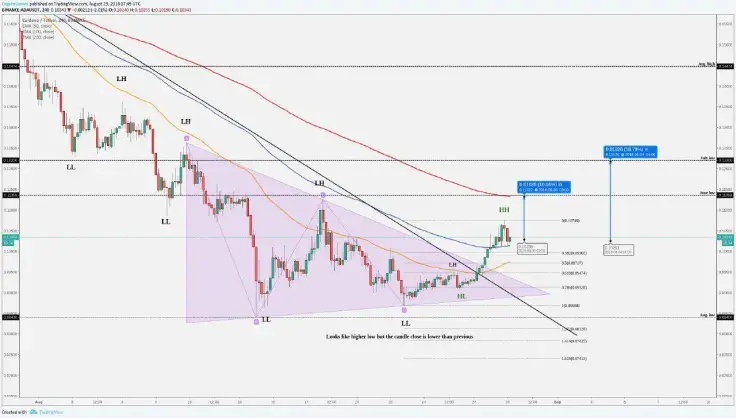
Around $0.09 area, we have found a bottom what we have tested two times and we can call this a "Double bottom" (W-formation)
After we made a second touch around $0.09 we have a steady climb upwards. Firstly, we break the down-trendline (which is pulled from 02.05.2018 and the second touch 18.07.2018) and we made a breakout from "Descending Triangle". The descending triangle is a bearish pattern but the triangle patterns have a breakout opportunities to either direction and at the moment we made a breakout upwards- bullish sign, and after those breakouts, we made a structure change, we manage to make HH (higher high) on the market!

Currently, you can see that there are two blue target boxes first is above the current price of 10 percent and the second 18 percent. So, probably there you can see some price bounce or price stop because those levels are historically worked. First one is June low/support which now becomes a resistance and the second one is the July low which now may become support!
If you want to enter the coin then there is an opportunity if the price falls down a little bit. Like you know we have a breakout from the triangle and the perfect breakout trade would be- breakout and wait for a retest! So, at the moment we could see that we may start to make a pullback because on the four-hour chart has formed a three candle candlestick pattern called "Evening Star" ( bearish pattern).
Currently looks like the solid spots where to enter the trade are:
$0.1 - criteria: round number, Fibonacci retracement level 38 percent and supported with EMA's
$0.095 - criteria: it would be close to retest area, perfect Fibonacci retracement level 62 percent
Hopefully, this helps you out a little bit to confirm your own analysis! Definitely make your own research!
Have a nice day!
 Vladislav Sopov
 Dan Burgin