Disclaimer: The opinions expressed by our writers are their own and do not represent the views of U.Today. The financial and market information provided on U.Today is intended for informational purposes only. U.Today is not liable for any financial losses incurred while trading cryptocurrencies. Conduct your own research by contacting financial experts before making any investment decisions. We believe that all content is accurate as of the date of publication, but certain offers mentioned may no longer be available.
Bitcoin has recently surpassed the $70,000 mark, showing the potential to reach $80,000. The chart reveals a strong performance with the price consistently maintaining above the 50-day moving average, which currently rests around $65,000.
The price is comfortably above the 200-day moving average, located near $48,000, which serves as a long-term indicator of support.
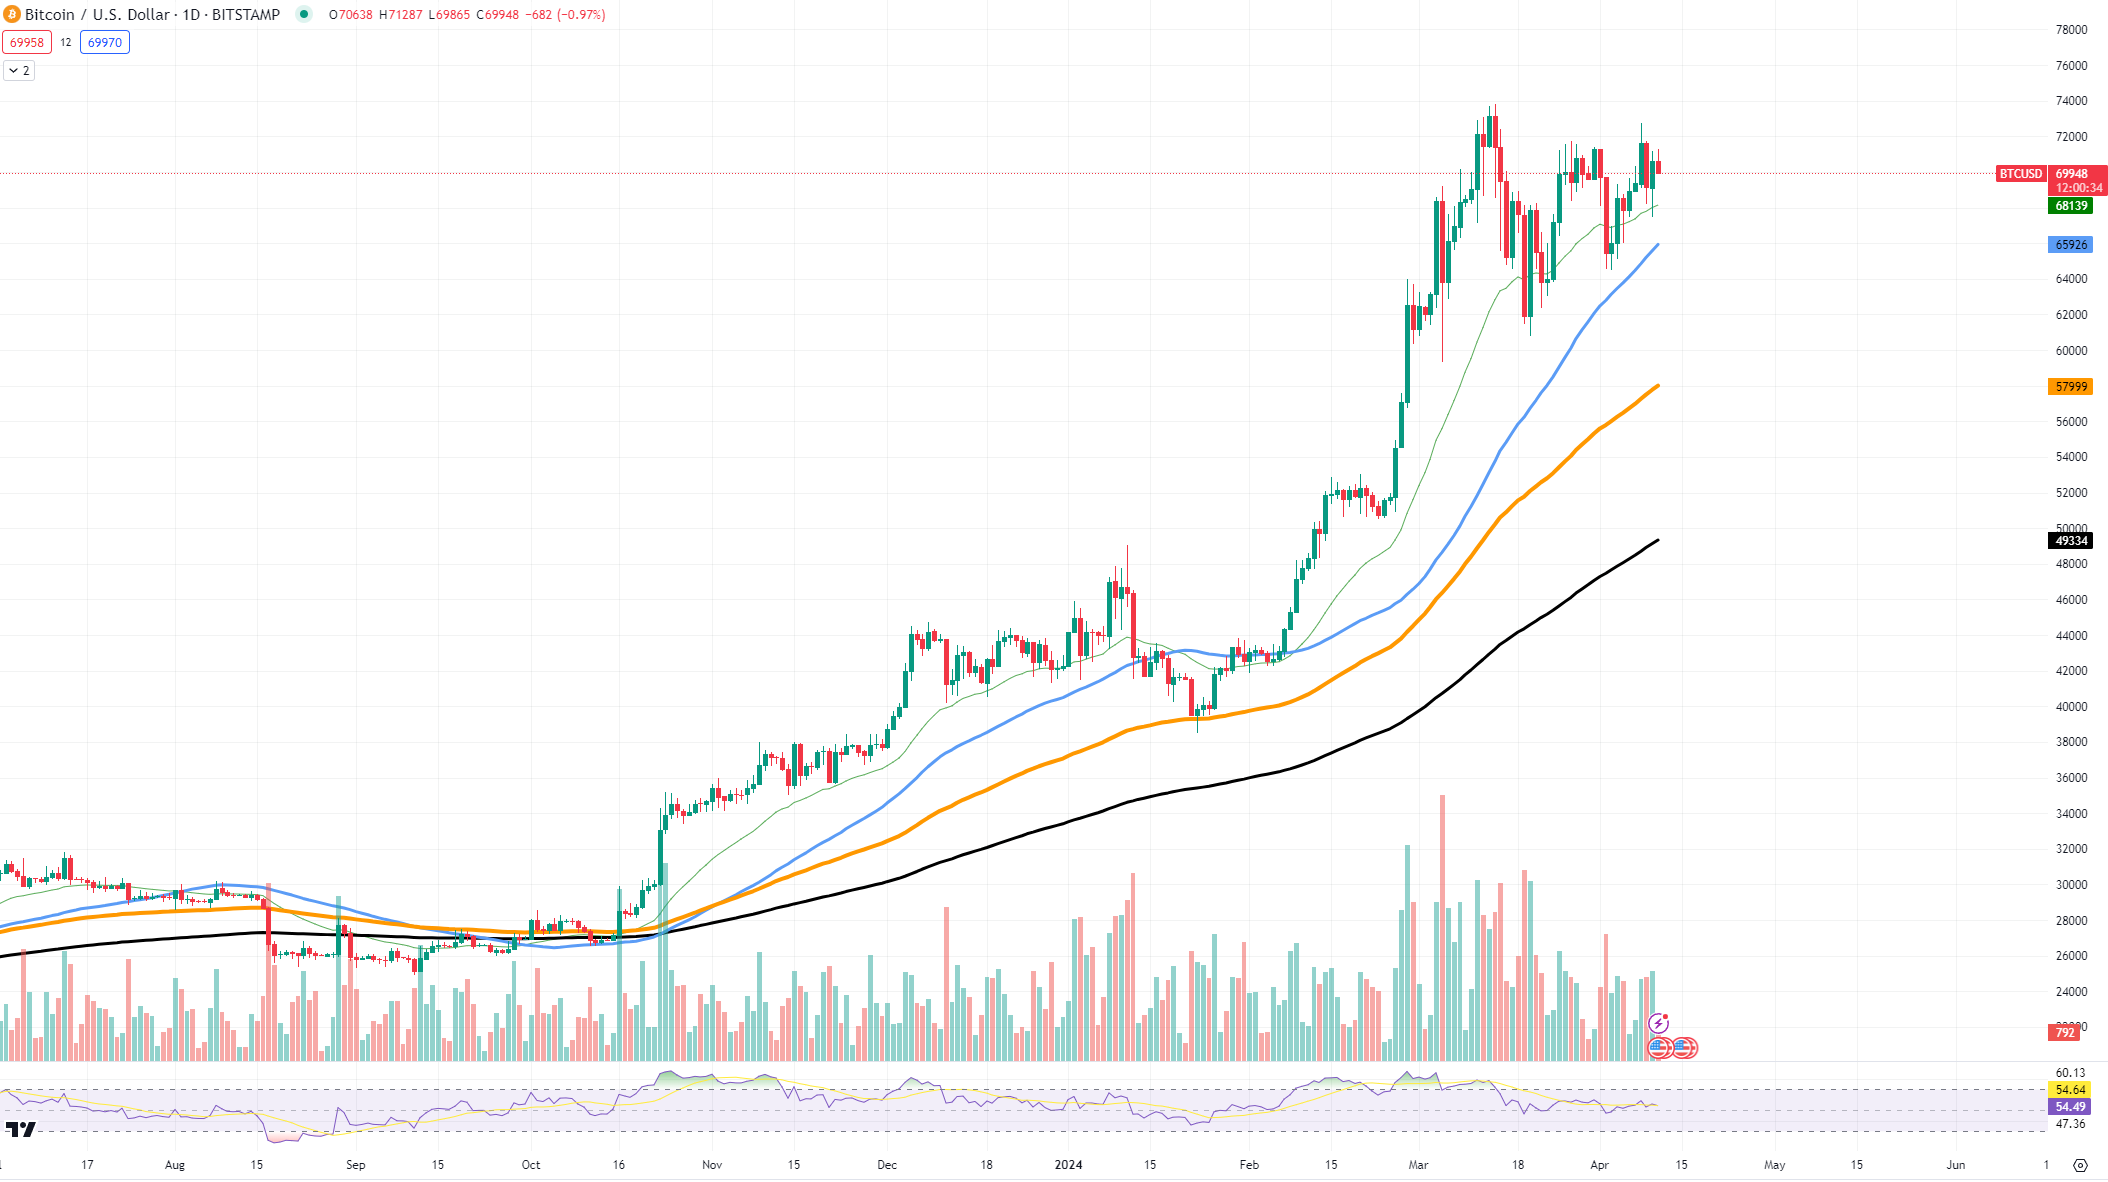
Bitcoin has touched and momentarily sustained levels above $70,000, which is indicative of a growing and improving market position. The Relative Strength Index (RSI) is placed around 60, which suggests that there is room for upward movement without the asset being overbought.
The first resistance for the digital gold is near the $76,000 level, which could potentially limit upward movements if not surpassed with substantial buying momentum. A well-defined support zone near $60,000 should offer a safety net against any short-term pullbacks. The current positioning of Bitcoin, slightly above $70,000, is critical, as it is indicative of the market's bullish sentiment.
If the momentum continues and buying pressure remains consistent, the possibility of Bitcoin reaching or even exceeding the $80,000 threshold appears within the realm of possibility.
Solana makes comeback
Solana is on a bullish, or positive, trend, according to its chart. The chart shows that after a price drop, a strong recovery took place, sending SOL above $170 again. This is usually a good sign and means the trend might reverse from falling to ascending. The price is now higher than some key levels that traders look at, suggesting it could continue going upwards.
SOL is above numerous moving averages, signaling a potential continuation of the bullish rally. Being above the 50-day average is a good sign for the short term performance of SOL, and being above the 200-day average is a good sign for the long term movement of the asset.
The amount of SOL being traded, or the volume, helps us understand if the trend is strong. For now, volume profiles show a descending tendency, signaling a potential weakness in the current trend.
For SOL, the RSI is going up, which usually suggests the growth of buying power. However, values too high would most likely lead to a reversal due to the limited room for potential price growth.
Overall, the SOL chart looks good. Prices are climbing and the important signs we are looking at are positive. If SOL keeps above the key levels, its price could rise even more. Tracking key indicators like volume and RSI could be go-to strategies right now. Any dips in price might be a chance to buy, but at the same time, a fall below crucial support levels will most likely lead to a prolonged reversal.
XRP gains some ground
XRP has finally solidified a crucial support level. It has sustained above the significant price level of $0.60, which has been the main battleground for bears and bulls for the last few weeks.
As for potential growth scenarios, the chart shows the possibility of a steady climb if the current support levels hold up. If buyers keep control over the chart, near the $0.65 mark — a peak that has thwarted previous rallies — may once again come into play. A break beyond this threshold could signal a march toward higher levels, with eyes set on the $0.70 horizon.
Conversely, should the winds shift and XRP's price falter below the $0.50 support, it could signal a retreat to lower depths, testing the resolve of holders and the strength of the market's sentiment.
XRP's future looks cautiously optimistic, but as always, you should stay cautious, considering the coin's performance in the past. Monitoring moving averages, RSI and volume could be a good idea when considering opening position in XRP, especially if your risk tolerance is not high.
 Dan Burgin
 U.Today Editorial Team