Disclaimer: The opinions expressed by our writers are their own and do not represent the views of U.Today. The financial and market information provided on U.Today is intended for informational purposes only. U.Today is not liable for any financial losses incurred while trading cryptocurrencies. Conduct your own research by contacting financial experts before making any investment decisions. We believe that all content is accurate as of the date of publication, but certain offers mentioned may no longer be available.
Aptos (APT), a recently launched cryptocurrency, has formed a symmetrical triangle pattern on its price chart, which could be an indicator of an upcoming spike in volatility. The chart pattern is commonly observed in various financial markets and often signals a period of consolidation before a significant price movement in either direction.
Since its initial airdrop, Aptos has encountered some challenges on the market. However, in January, the digital asset experienced a massive rally, surging approximately 413% in value. As expected, a correction followed, and Aptos lost around 40% from its local high. The formation of a symmetrical triangle pattern on the APT price chart now suggests that we might see a continuation of the uptrend in the near future.
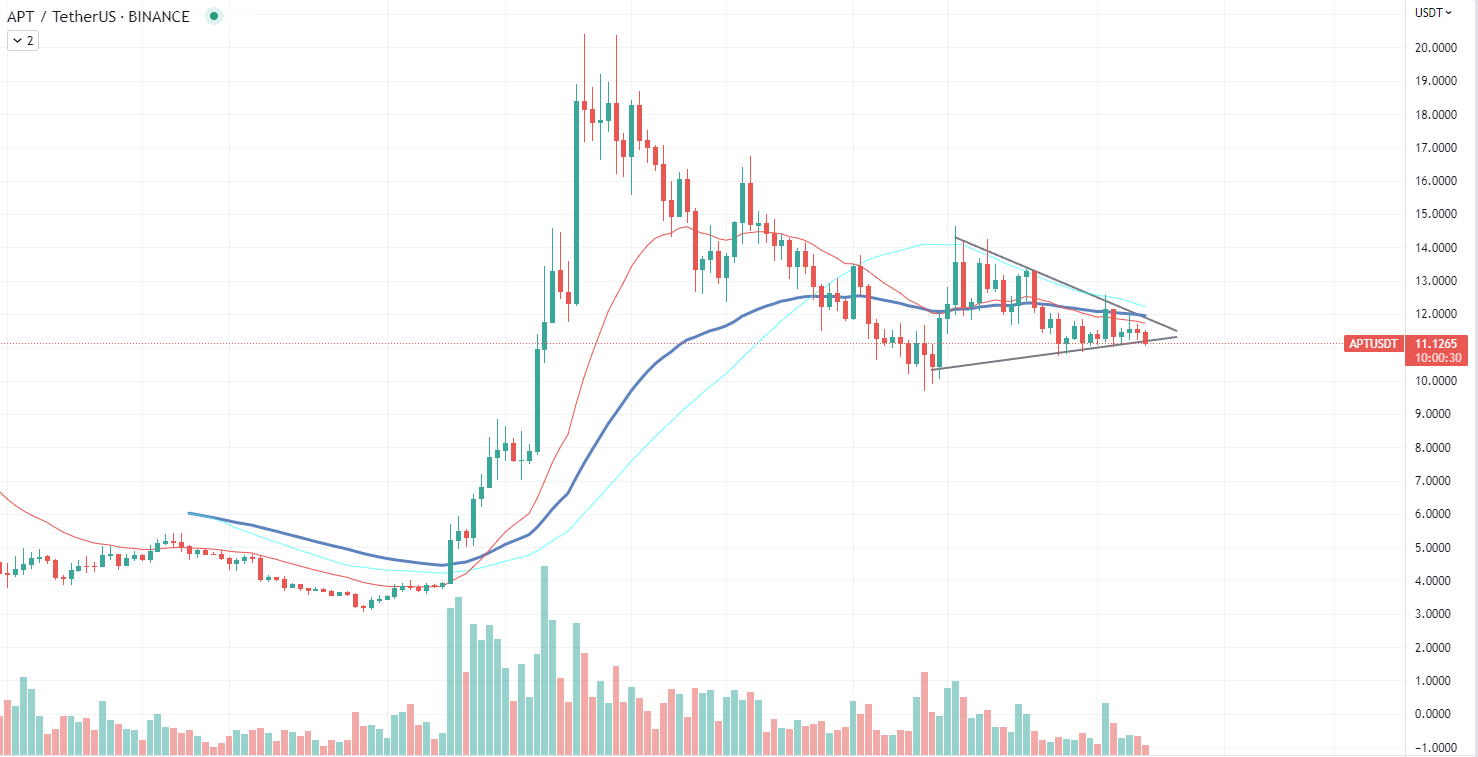
The symmetrical triangle pattern is typically considered a continuation pattern, meaning that the prevailing price trend before the formation of the triangle will likely resume once the pattern completes. In Aptos' case, the pattern follows a significant uptrend, suggesting that the price of APT could potentially break out to the upside once the triangle resolves.
However, it is important to note that while the symmetrical triangle pattern is commonly viewed as a continuation pattern, it can also occasionally result in a reversal of the existing trend. As such, traders should exercise caution when trading based on this pattern alone, considering other factors such as market sentiment, trading volume and any relevant news or developments surrounding the Aptos project.
Shiba Inu separates itself
Shiba Inu (SHIB) has recently been demonstrating a downtrend in its correlation with major assets such as Ethereum (ETH), suggesting that it is becoming a more independent digital asset. The lower correlation with other assets allows for greater possibilities of unexpected price movements, potentially allowing SHIB to exhibit upward trends and withstand market corrections more effectively.
One of the benefits of a lower correlation is that it may allow SHIB to experience upward price movements even when the rest of the market is experiencing a downturn. This makes the token a potentially valuable asset for investors seeking to capitalize on positive price movements that are not necessarily in line with the overall market trend.

Moreover, the decreased correlation with other assets could also provide some insulation for Shiba Inu during market corrections. When the broader market experiences a downturn, highly correlated assets often see similar price declines. However, an asset with a lower correlation may be less affected by these broader market shifts, providing a level of protection for investors holding that particular asset.
Cardano loses momentum
Recent on-chain and market data for Cardano (ADA) paint a bleak picture, as investors are moving significant amounts of ADA out of staking, possibly indicating an active profit-taking strategy. Furthermore, many of Cardano's key metrics have returned to their lows, suggesting a period of stagnation for the cryptocurrency. The situation could, however, change once the overall market activity normalizes.
A large-scale withdrawal of ADA from staking pools is a potential red flag for the Cardano ecosystem, as it may suggest that investors are opting to take profits instead of maintaining their long-term commitment to the network. This could lead to increased selling pressure on the market, driving ADA's price downward and potentially discouraging new investors from entering the ecosystem.
In addition to the decline in staking, Cardano's metrics have been experiencing a slump, with many indicators returning to their previous lows. This stagnation is concerning for the cryptocurrency, as it implies that Cardano's growth and adoption may have hit a plateau. The lack of momentum could deter potential investors and hinder the network's ability to compete with other prominent blockchain platforms.
 Dan Burgin
 U.Today Editorial Team