
Disclaimer: The opinions expressed by our writers are their own and do not represent the views of U.Today. The financial and market information provided on U.Today is intended for informational purposes only. U.Today is not liable for any financial losses incurred while trading cryptocurrencies. Conduct your own research by contacting financial experts before making any investment decisions. We believe that all content is accurate as of the date of publication, but certain offers mentioned may no longer be available.
Technical indicators of a possible price squeeze are being displayed by XRP as its chart patterns and market dynamics suggest a major move is imminent. The asset is still in a local uptrend, but underlying signals indicate that volatility may soon reappear. The convergence of moving averages is one of the major advancements.
Closer proximity of the 20, 50 and 100-day moving averages produces a compression effect that frequently precedes abrupt breakouts or breakdowns. A time of consolidation, when buyers and sellers are in relative balance, is reflected in this technical squeeze, but this equilibrium rarely endures. Consolidation phases are often characterized by a steady decline in volume.
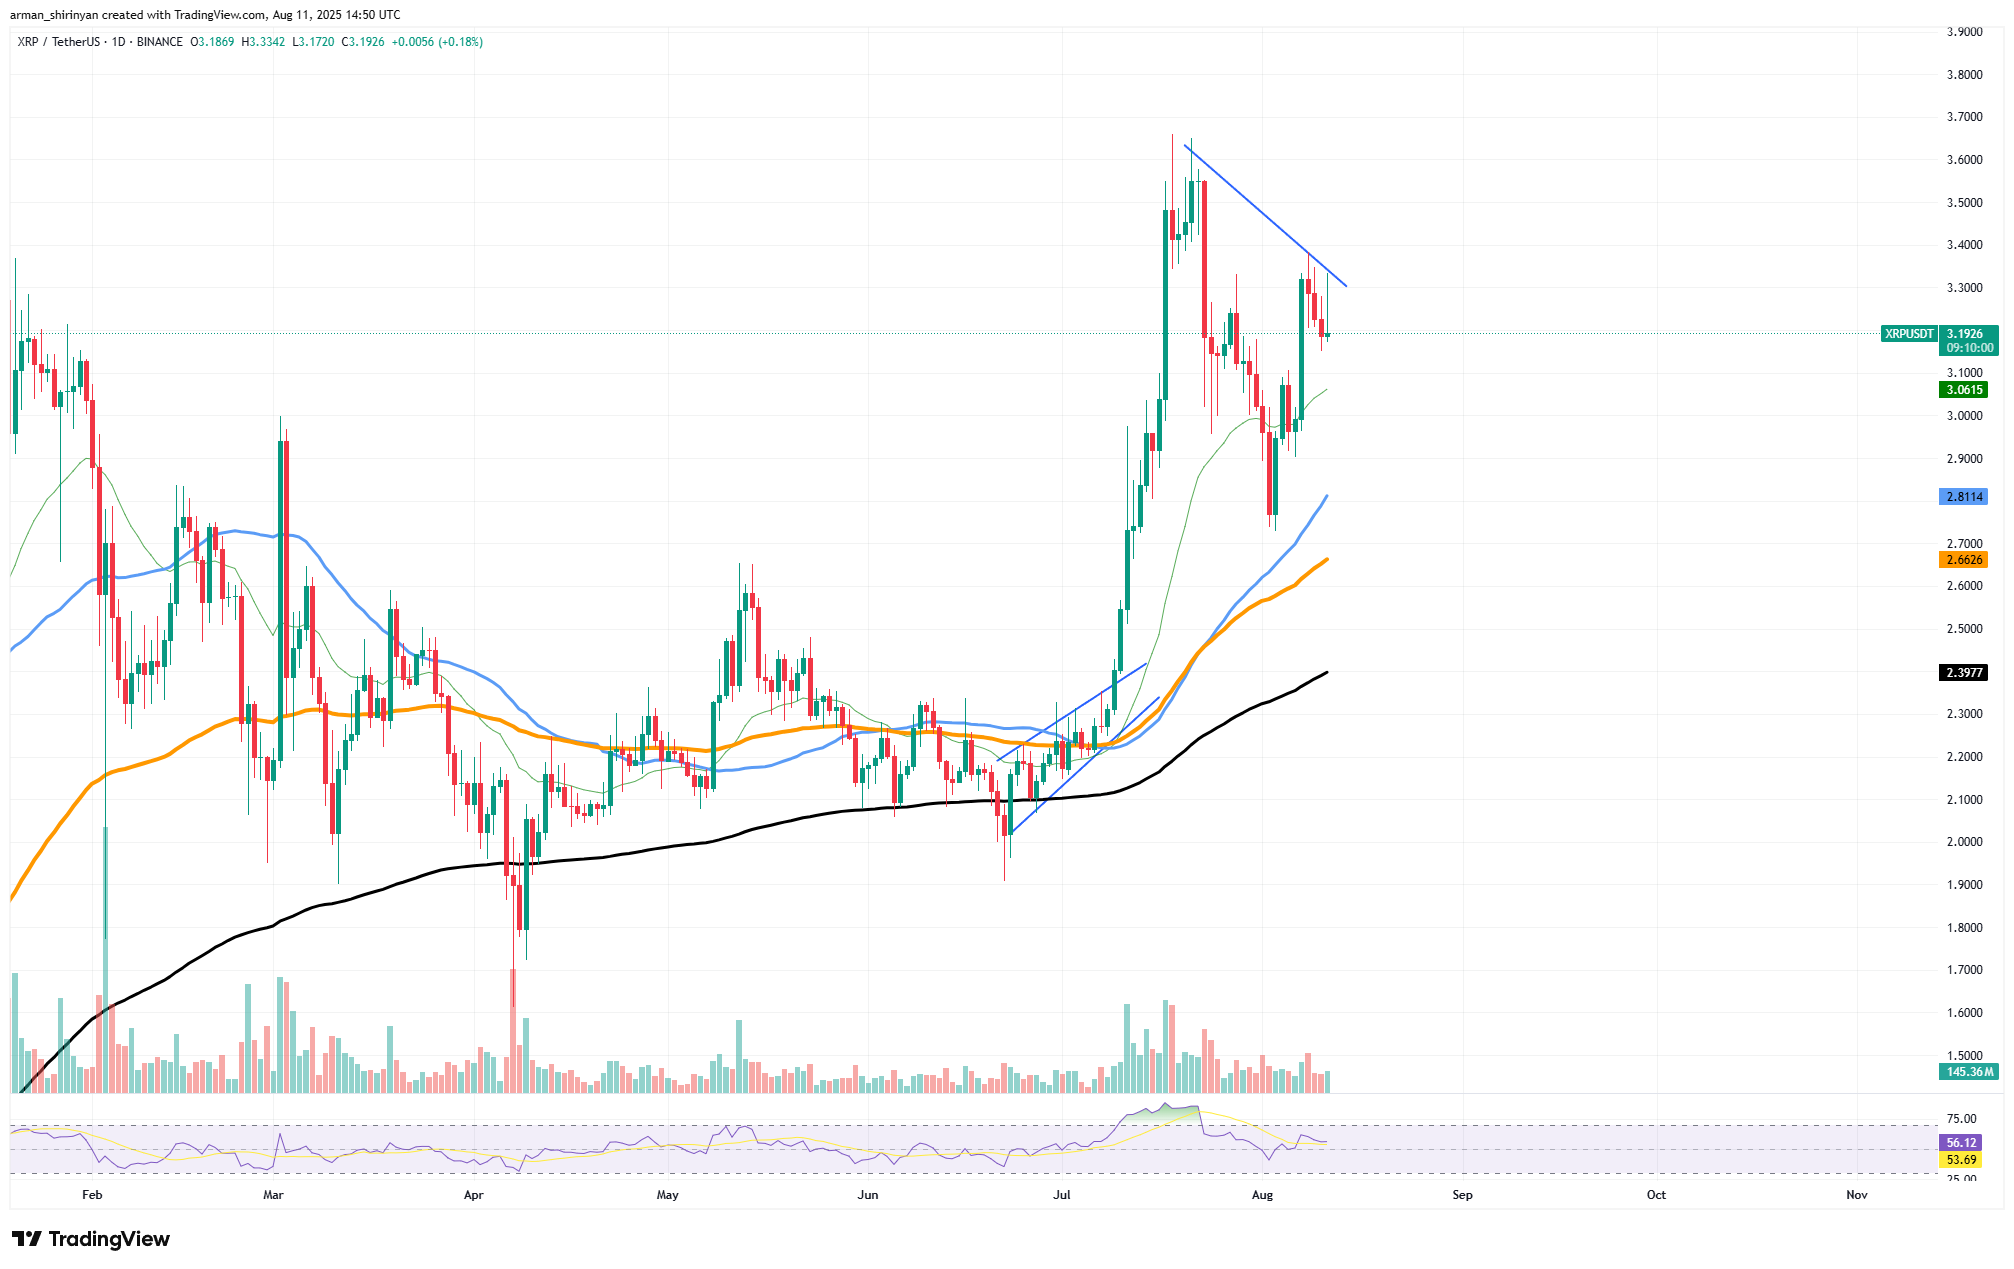
Reduced trading activity can be deceptive because it could conceal mounting pressure below the surface. Significant directional moves have frequently followed prolonged periods of low volume in XRP's price action once volume has returned. A descending trendline formed from recent highs adds to the mix. Upside attempts have been capped thus far by this overhead resistance, drawing a clear line of battle between bulls and bears.
With strong supporting volume, XRP must decisively break above this descending resistance in order for the uptrend to pick up steam. The local uptrend is unaffected by these technical limitations. It appears that buyers are still defending important support levels and setting up for a possible breakout as higher lows keep forming.
XRP may swiftly retest the $3.40-$3.50 range if it is able to break through the descending trendline. Failure to break out though could result in a retest of lower supports at $3.06 or even $2.82.
Dogecoin's top
Dogecoin's price movement is forming a possible local double top — one of the least desirable chart patterns for bulls. Following DOGE's unsuccessful attempt to break through the $0.30 zone in late July and its subsequent attempt in early August, which ended at a lower high close to $0.27-$0.28, the pattern is beginning to take shape. If confirmed by a breakdown below important support, a double top can signal a reversal and frequently signals waning bullish momentum.
Given that several moving averages have converged below the current price, Dogecoin's support is currently located between $0.21 and $0.22. The 50-day moving average crossing above the 200-day moving average is known as a golden cross, and DOGE is getting close to this bullish event.

Nevertheless, a strong follow-through is not supported by the current circumstances. The golden cross may not produce a long-term upward trend because price momentum is slowing, and there has not been a breakout to new highs. Additionally, volume data is not something you would desire right now.
If selling pressure rises, lower volume might facilitate the traction of downward price movements. There is no strong directional momentum or notable divergence that would suggest an impending breakout, as indicated by the Relative Strength Index (RSI) being flat in the neutral zone around 50-55. The double top pattern is still possible if Dogecoin does not make a strong recovery and move above $0.28.
Risk factor for Ethereum
After weeks of steady growth, Ethereum recently broke through the $4,400 barrier, continuing its strong bullish run. But even with the price action we are seeing right now, there are warning signals flashing. The Relative Strength Index's (RSI) bearish divergence is the most notable one.
The RSI has failed to follow the price, forming a lower high in place of the higher high that the price of ETH has printed relative to its previous local peak. Even as the price rises, this divergence frequently indicates that the rally's momentum is waning. In the past, these trends have come before brief declines or consolidations, particularly following protracted rallies.

The recent upward legs of decreasing short-term trading volume adds to the bearish outlook. Even though there are sporadic high volume spikes on the chart, which is a great indication of market activity, the daily volume trend is generally declining. This might suggest that fewer traders are prepared to pursue the rally at the current levels, which would raise the possibility of corrections driven by volatility.
Regarding volatility, the wide range of ETH's price fluctuations indicates that the market is still experiencing intense emotional volatility. Risks are increased even though this may present chances for rapid gains, especially if the divergence materializes and leads to a more thorough retracement.
Though traders should stay vigilant, ETH is currently showing strong bullish momentum. The impact of the divergence could be confirmed and a pullback toward the $3,950-$4,000 range could be possible, if there is a break below the short-term supports that are currently in place, especially those in the $4,250-$4,300 range. On the other hand, if bulls are able to maintain volume and disprove the divergence, Ethereum may continue to rise to new heights.
 Dan Burgin
 U.Today Editorial Team