

Disclaimer: The opinions expressed by our writers are their own and do not represent the views of U.Today. The financial and market information provided on U.Today is intended for informational purposes only. U.Today is not liable for any financial losses incurred while trading cryptocurrencies. Conduct your own research by contacting financial experts before making any investment decisions. We believe that all content is accurate as of the date of publication, but certain offers mentioned may no longer be available.
Shiba Inu (SHIB), the dog-inspired cryptocurrency that emerged as a prominent player in the meme coin space, is demonstrating robust resilience in the current market scenario. The reason behind its surprising strength lies in its recent stable price performance following the successful completion of an ascending triangle pattern.
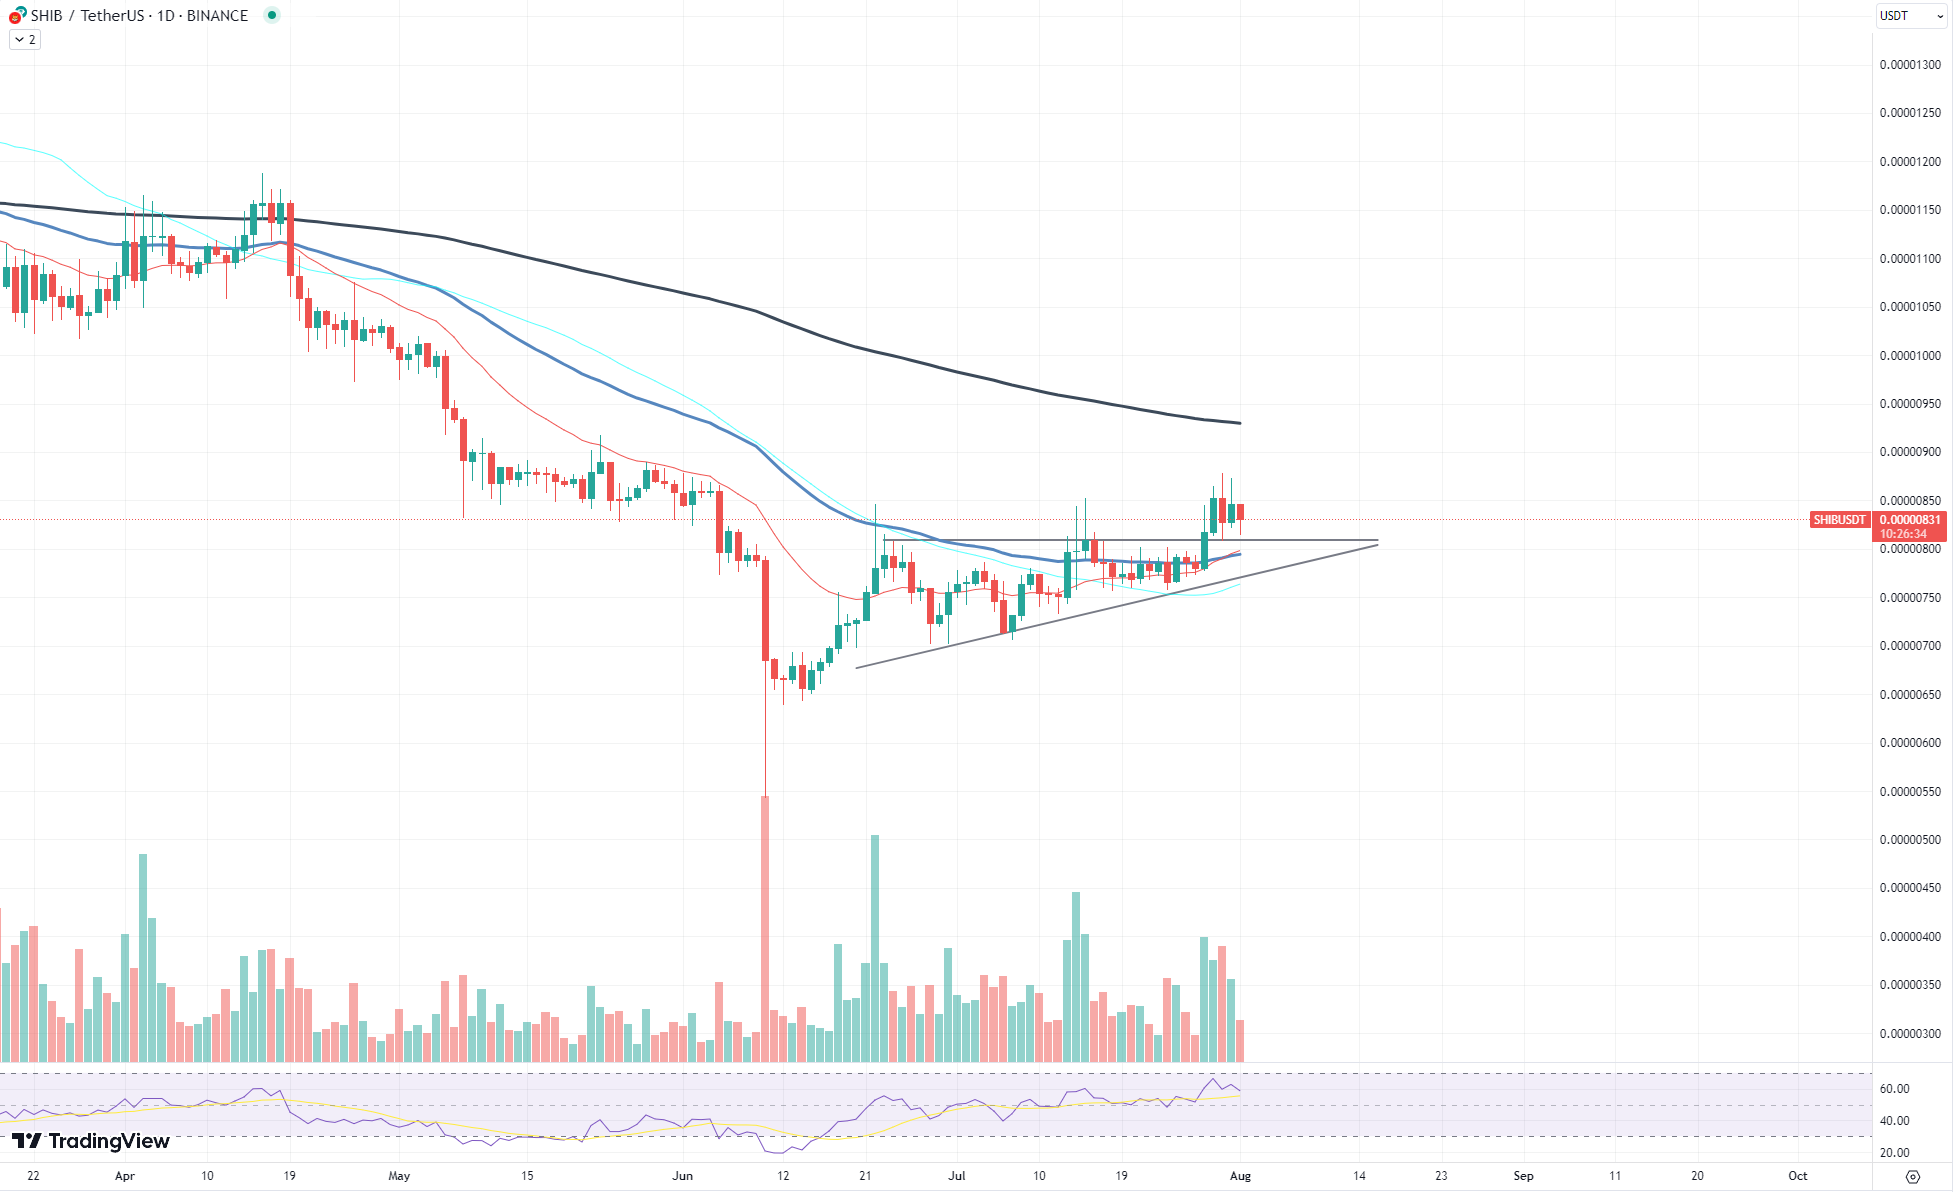
The ascending triangle pattern is a bullish indicator, typically associated with the continuation of an uptrend. Shiba Inu's successful breakthrough of this pattern demonstrated its strong market momentum and set the stage for the stability that followed.
Over the past several trading sessions, Shiba Inu has been trading at around $0.00000829. While these price levels may not seem significant at first glance, they represent an essential stability factor in a market known for its volatility. By maintaining a stable price performance amid fluctuating market conditions, Shiba Inu has proven itself to be a formidable player in the crypto space.
Further evidence of Shiba Inu's strength is the consistent trading volume and its relative strength index (RSI), currently standing at 70. The steady volume indicates sustained interest from traders and investors, while the RSI level, although high, suggests there is still room for growth.
Cardano hit
Cardano (ADA), one of the leading cryptocurrencies on the market, has taken a substantial hit. In the last 24 hours, the digital asset has lost more than 7.4% of its value. This significant reduction wiped out most of the gains ADA had been making since July 25.
Before this unexpected drawdown, Cardano was demonstrating promising signs of growth. Over a span of just a few days, ADA had gained 5% to its value. This positive trend had sparked optimism among investors and market participants, raising expectations of further gains. However, the sudden drop in Cardano's price, where it lost over 7% at its lowest point, caught the market by surprise.
This unexpected fall raises questions about the potential end of the recent uptrend. While the cryptocurrency market is known for its volatility, such abrupt reversals in price trends can have significant implications. When a promising uptrend is abruptly broken, it not only affects investor sentiment but can also lead to cascading sell-offs, which could further push down the price.
One question that remains is what might have triggered this sudden drawdown. While specific catalysts are yet to be identified, it is crucial to note that the cryptocurrency market is influenced by a range of factors, including macroeconomic events, investor sentiment and specific news relating to individual cryptocurrencies.
Ethereum faces challenges
Ethereum (ETH), the world's second-largest cryptocurrency by market capitalization, is currently navigating a challenging market scenario. After a considerable bearish phase, Ethereum's price fell below the key support level of $1,850 and the 50-day Exponential Moving Average (EMA). This bearish momentum suggests that the cryptocurrency might be heading toward a new support level.
The 200-day EMA, a widely watched technical indicator, currently sits below the $1,800 price level. Ethereum's recent price movement indicates that it is aiming for this new support. If the cryptocurrency manages to breach this level, it could signify a continuation of the bearish trend.
However, not all indicators point toward an unabated downward trend. While the current market picture for Ethereum might seem grim, a subtle positive hint comes from its trading volume. Ethereum's trading volume is on a downtrend, which, paradoxically, could signal a potential bullish price reversal.
Decreasing volume during a bearish trend is often a sign that the selling pressure is losing momentum. If this trend continues, it could lay the foundation for a bullish reversal. However, this scenario could take weeks, if not months, to unfold.