
Disclaimer: The opinions expressed by our writers are their own and do not represent the views of U.Today. The financial and market information provided on U.Today is intended for informational purposes only. U.Today is not liable for any financial losses incurred while trading cryptocurrencies. Conduct your own research by contacting financial experts before making any investment decisions. We believe that all content is accurate as of the date of publication, but certain offers mentioned may no longer be available.
Shiba Inu (SHIB), the popular meme coin, is currently displaying an intriguing pattern on its price chart, drawing significant attention from market analysts and retail investors alike. The cryptocurrency is forming an ascending triangle, a powerful technical pattern that often precedes a volatility spike.
The ascending triangle is defined by a flat upper resistance line and an upwardly sloping lower trend line. As the price of SHIB moves closer to the apex of the triangle, traders are eagerly awaiting a potential breakout that could significantly shift the token's price.
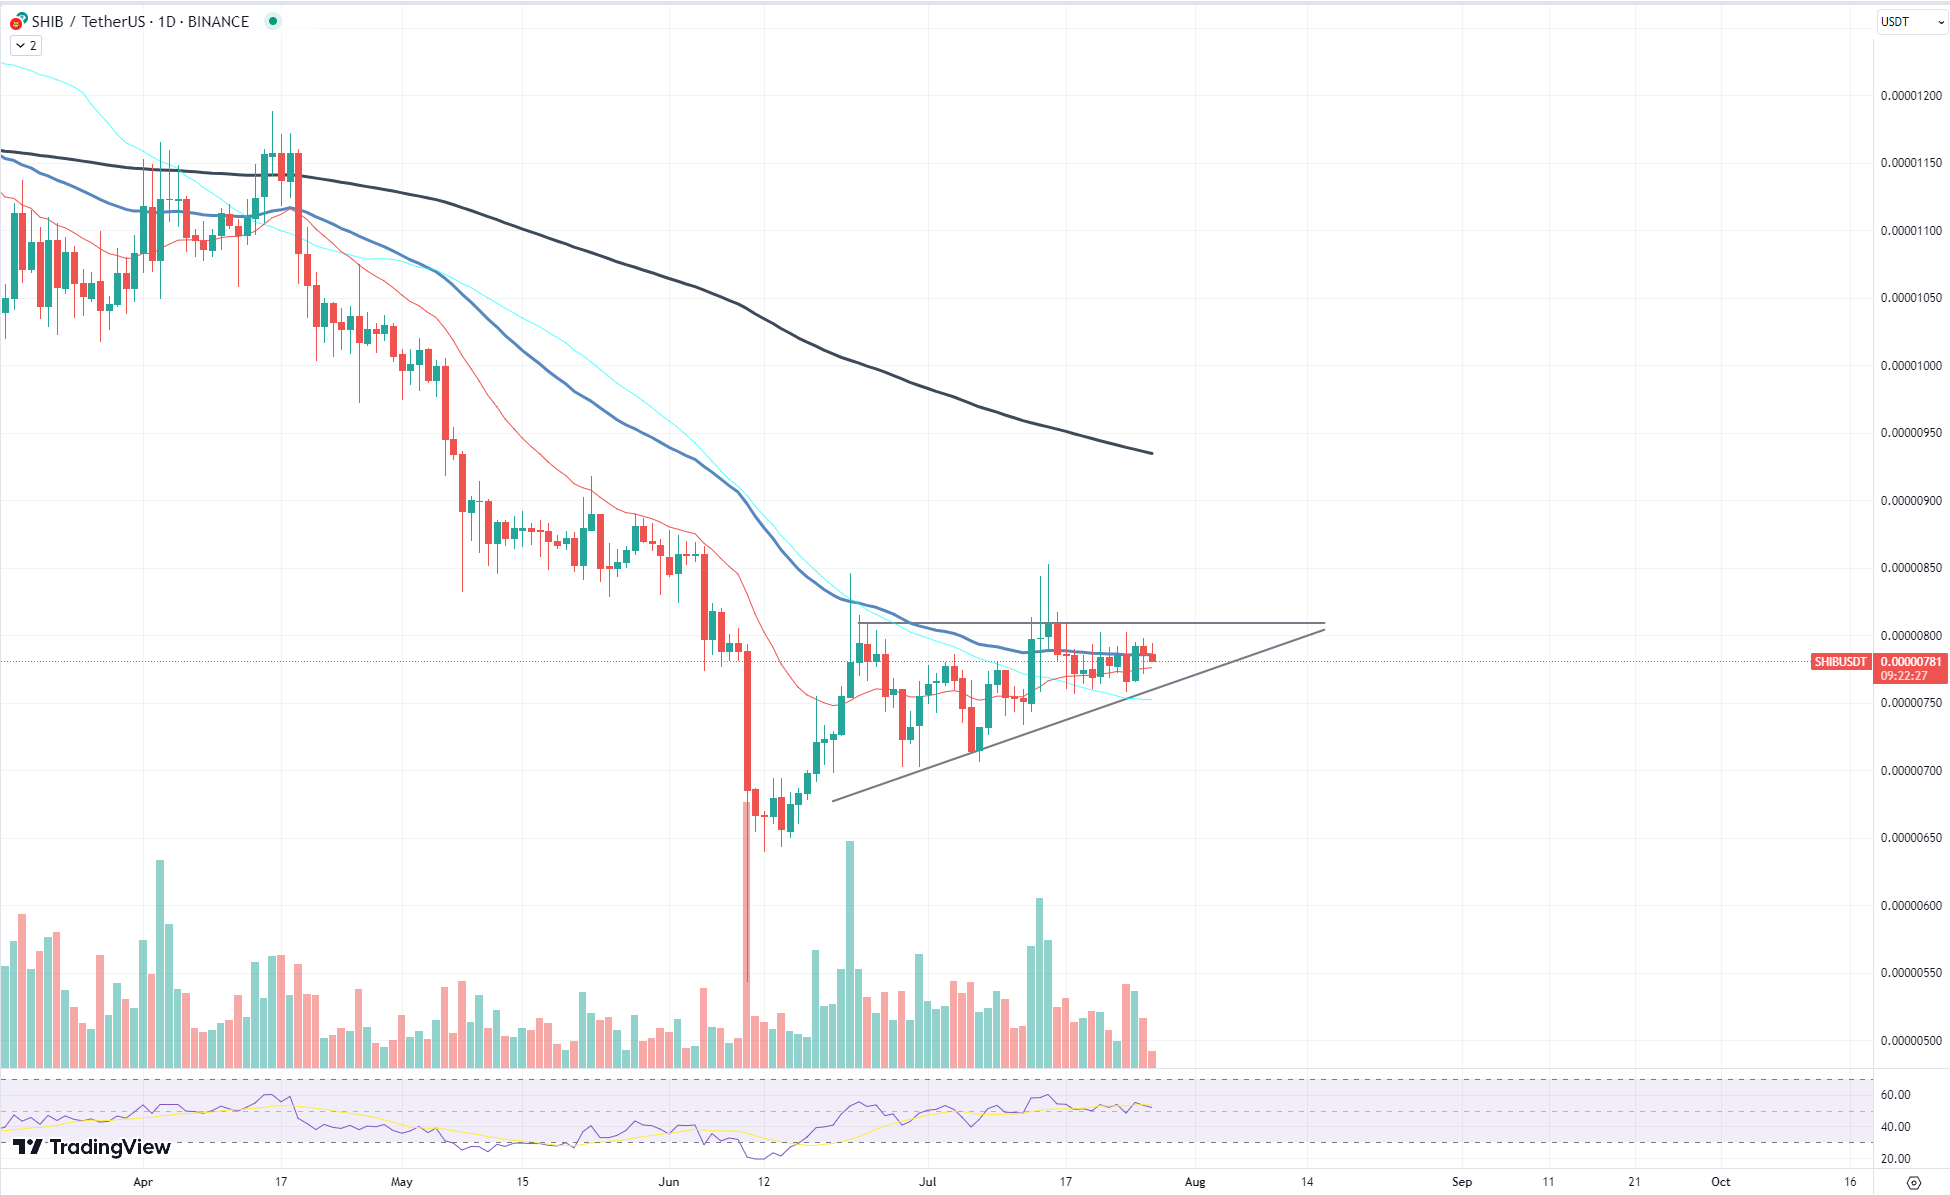
Interestingly, SHIB managed to overcome its 50-day moving average recently. This is a positive sign, often seen as a bullish indicator by traders. However, the challenge lies in maintaining this momentum and breaking above the upper resistance line of the triangle. If SHIB can accomplish this, it could lead to a substantial uptrend.
However, the scenario leading up to this pattern formation has been somewhat atypical. Shiba Inu, known for its volatile swings and thus attracting investors seeking high returns, has recently seen unusually low volatility levels. This has made the token less appealing to retail investors, who tend to thrive on price swings and quick profits.
Worldcoin's expected performance
Worldcoin (WLD), the digital currency backed by OpenAI CEO Sam Altman, has seen a significant slump in its price recently. The cryptocurrency that has been a hot topic in the crypto sphere took a nosedive, defying the initial positive sentiment surrounding its launch.
From its local high of $3.3, Worldcoin's price has tumbled down to a current trading value of around $2.2. This is almost a 30% drop in value, a stark contrast to the optimistic projections that had been circulating in the wake of Worldcoin's announcement.
Worldcoin's goal to create a decentralized proof-of-personhood system, where every individual on Earth has a unique digital ID, had initially captured the attention of the crypto community. The project aimed to utilize this system to distribute a universal basic income, leveraging the efficiency and security of blockchain technology.
However, the price performance suggests that the market's initial enthusiasm might have faded. The nearly 30% dip from its local high could be indicative of a couple of factors. First, it might suggest that the market's expectation for Worldcoin was overly optimistic, and the price is now correcting to a more realistic level. Alternatively, it could be the result of broader market trends affecting the overall cryptocurrency landscape, or perhaps concerns about Worldcoin's proposed model.
Chainlink's other surge
Investors in and observers of Chainlink (LINK) may have noticed a trend over the past few months. The blockchain oracle platform has seen a consistent pattern of price surges, and if the trend continues, it may be poised for another.
Over the last few months, LINK has been witnessing remarkable growth. The two previous surges brought the LINK price up by 14% and 19%, respectively, indicating strong upward momentum. Following a similar pattern, LINK is currently experiencing an 8% rise.
What is even more interesting is the volume profile. An ascending volume trend has been accompanying these price increases. This suggests increased trading activity and could indicate strong buying sentiment among investors. When combined with the upward price trend, this presents a bullish picture for LINK.
Further supporting the bullish narrative is the near golden cross formation on LINK's chart. A golden cross occurs when a short-term moving average crosses above a long-term moving average, usually the 50-day and 200-day moving averages, respectively. This is often seen as a bullish signal by traders and can lead to increased buying activity.
Should these patterns continue, we could see LINK surge another 14%, similarly to previous instances. This could push the token's price even higher and extend its overall growth, which is already an impressive 56% over the last few months.
 Dan Burgin
 U.Today Editorial Team